The future of sales through smart data visualization
- Industry: EdTech
- Country: India
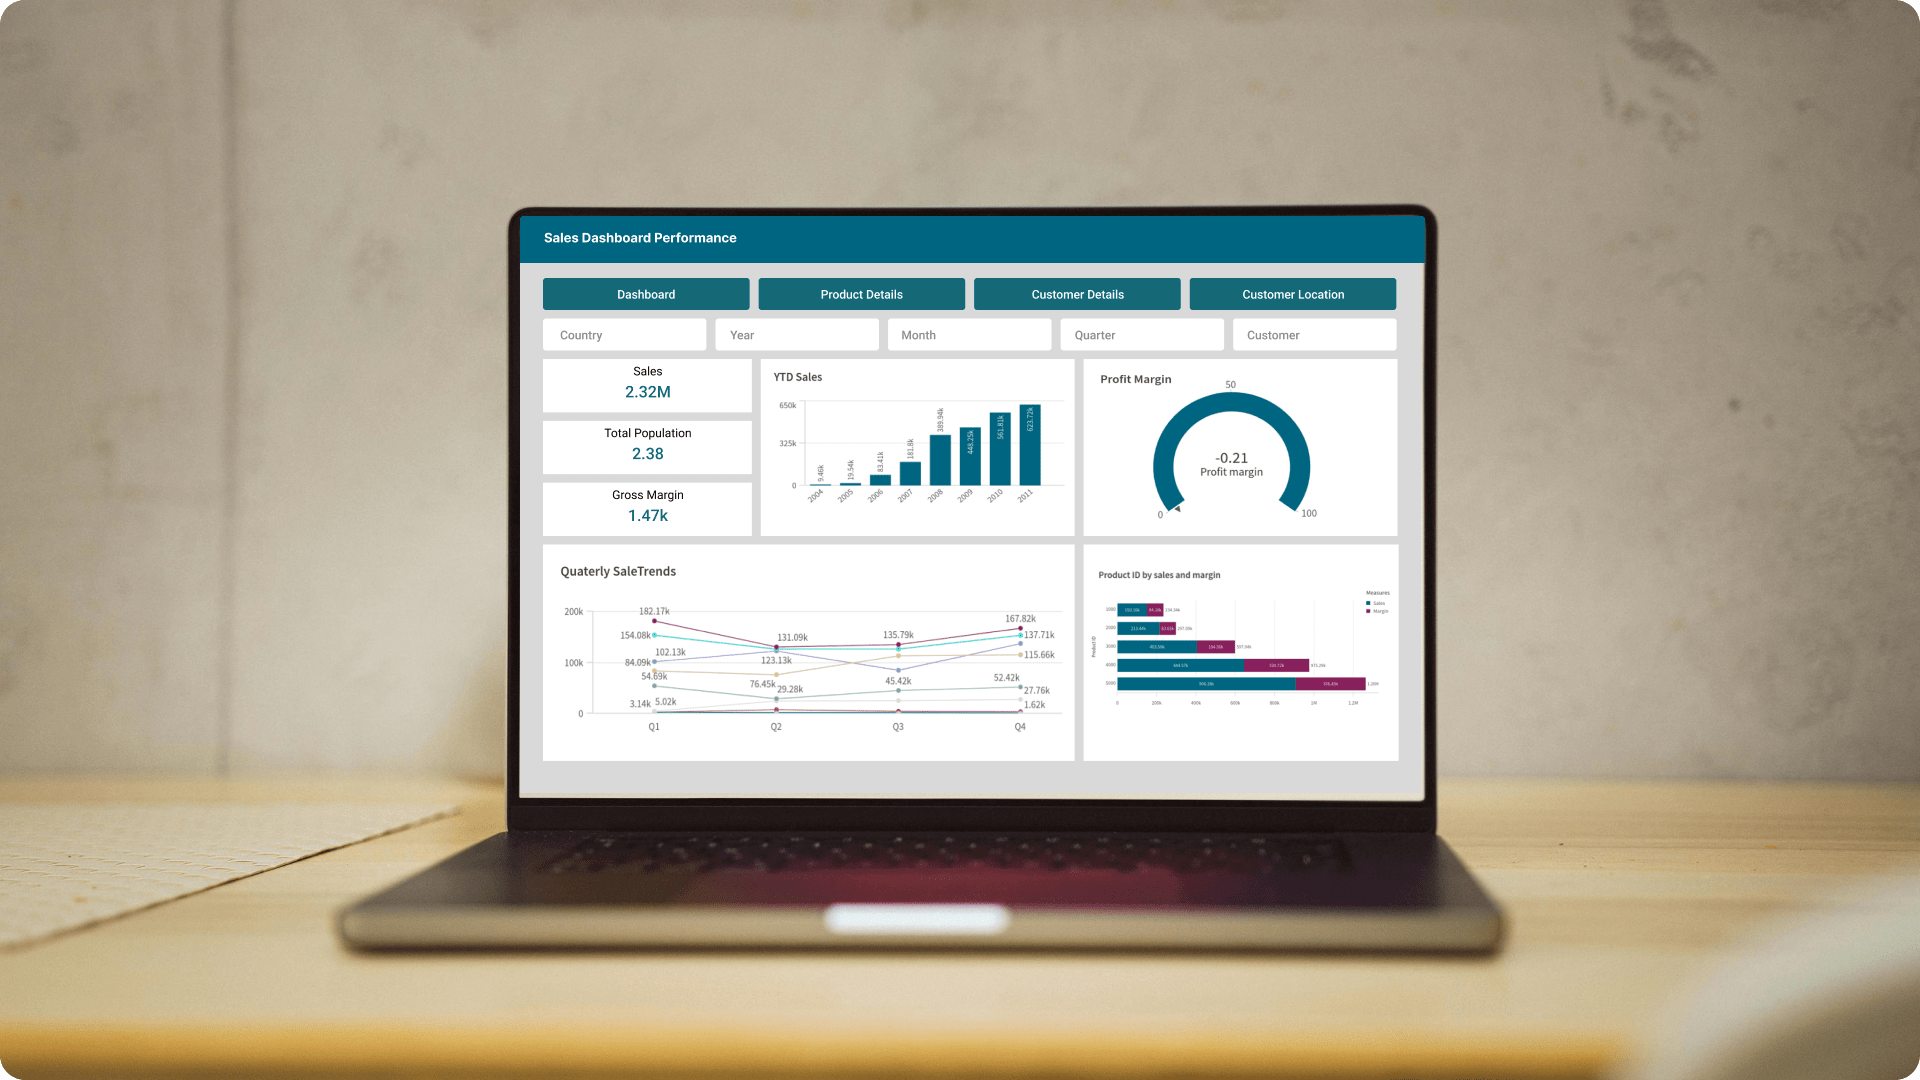
The goal of the sales dashboard is to provide clear and actionable insights into sales performance, customer demographics, and geographical trends. By leveraging data from various sources, the dashboard aims to support strategic decision-making, identify key sales drivers, and uncover opportunities for growth and improvement.
The core challenges
- Data integration: Merging data from different sources (like Country, Customer, Sales) with different formats and structures. Used Qlik Sense’s Data Load Editor to combine and clean the data into one unified model.
- Performance optimization: Large datasets and complex calculations can slow down the dashboard. Optimized the data model and use efficient scripting to keep the dashboard fast and responsive.
- Real-time data refresh: Keeping the dashboard up-to-date with the latest data. Set up automatic data refresh schedules and load only new or changed data to keep updates timely.
- User experience: Designing a dashboard that is both intuitive and accessible to non-technical users can be difficult, especially when dealing with complex data and multiple visualizations. Created clear, interactive visualizations and an easy-to-navigate layout to ensure a smooth user
- Data accuracy: Ensuring data accuracy, particularly with sales figures and customer information. Implement Qlik Sense’s data validation and quality checks during the data load process to maintain accuracy.
Solution We’ve developed an advanced data visualization tool that simplifies the presentation of complex data, making it easy to understand and interpret.
-
 Dashboard usability: Used Qlik Sense’s storytelling feature to create guided data exploration and insights, making complex data more digestible.
 -
 Dashboard layouts: Users to personalize their dashboard by selecting preferred charts and key performance indicators (KPIs) for a tailored experience.
 -
 Embedded reports: Our solution allows you to embed Qlik Sense reports and dashboards directly into our custom applications or websites, providing users with easy access to financial insights within their workflow.
Integration.
Equipped with a variety of
data sources.
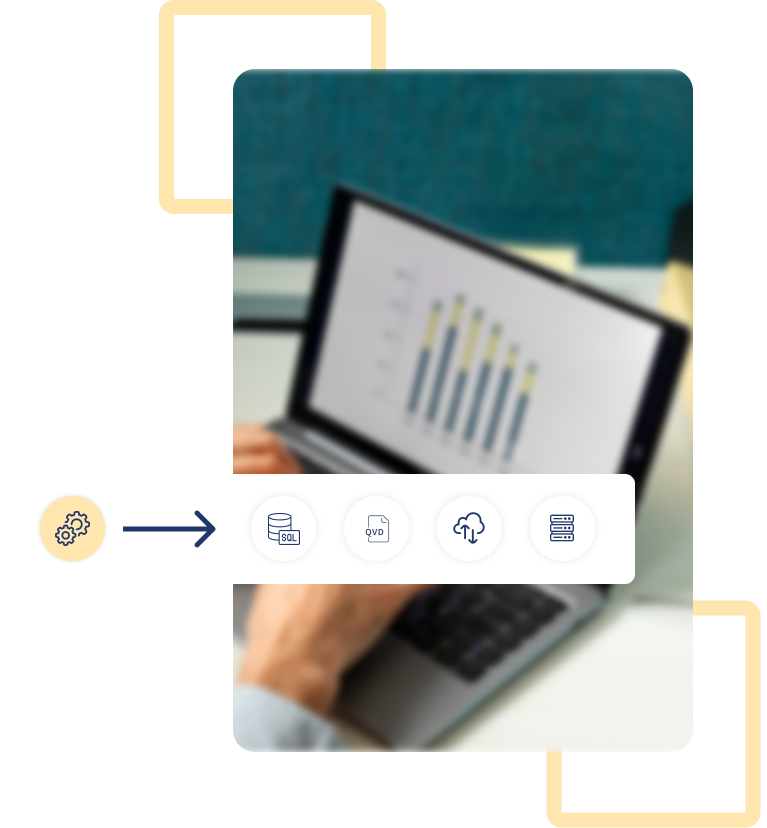
Qlik Sense's power and flexibility are greatly enhanced by its integration with a wide range of applications and tools. This report examines several of these integrations and their impacts.
- Flat files
- QVD files
- SQL
- Oracle
Customization.
We've tailored each chart to enhance data visualization, aligning them with specific characteristics to ensure accurate representation. This customization improves both insights and usability.

Dynamic filters
Use Qlik Sense’s filter panes and variables to enabledynamic filtering of data by various dimensions.
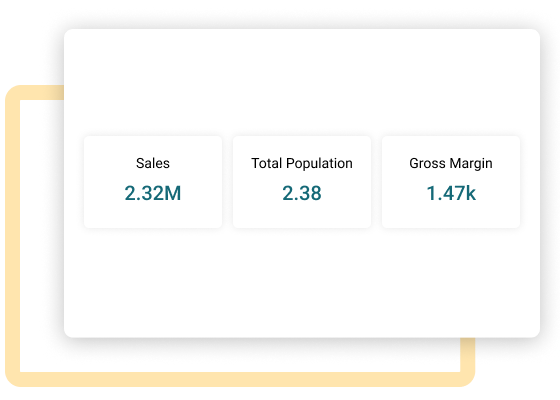
Custom calculations
Utilize Qlik Sense’s scripting and expression editor to create custom KPIs such as Gross Margin and Sales Growth.
Personalized dashboard layouts
Provided options for users to customize their dashboard layouts, allowing them to arrange widgets, charts, and KPIs according to their needs and preferences.
Enhancement.
By adding useful features.
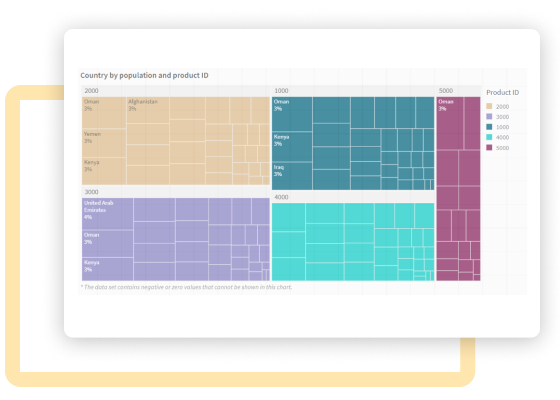
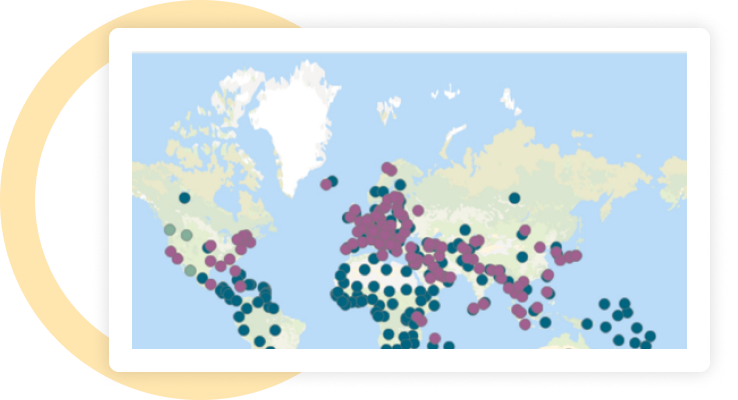
Enhanced data visualizations
Develop advanced visualizations, such as geo-maps and to better illustrate data patterns and relationships.
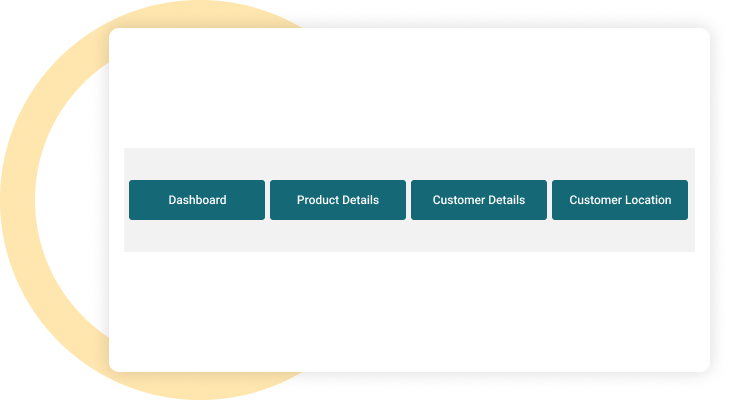
Navigation buttons
Incorporate navigation buttons to easily move between different sections or pages of the dashboard, improving overall usability and user experience.
Explore more.
Additional features.
Advanced filtering options. Introduced advanced filtering options to allow users to refine data analysis based on specific criteria, such as patient demographics, medical conditions, time periods, and hospital locations. This enhances data exploration and provides targeted insights into readmission patterns.
Collaboration features. Integrated collaboration tools like commenting, annotation, and sharing functionalities within Qlik Sense. These features support teamwork and knowledge sharing among healthcare providers, encouraging a collaborative approach to developing strategies for reducing readmissions.
Export preferred charts/KPIs. Users are given an intuitive interface that enables them to effortlessly select and export their chosen charts and KPIs from the Customer Qlik Sense app.


