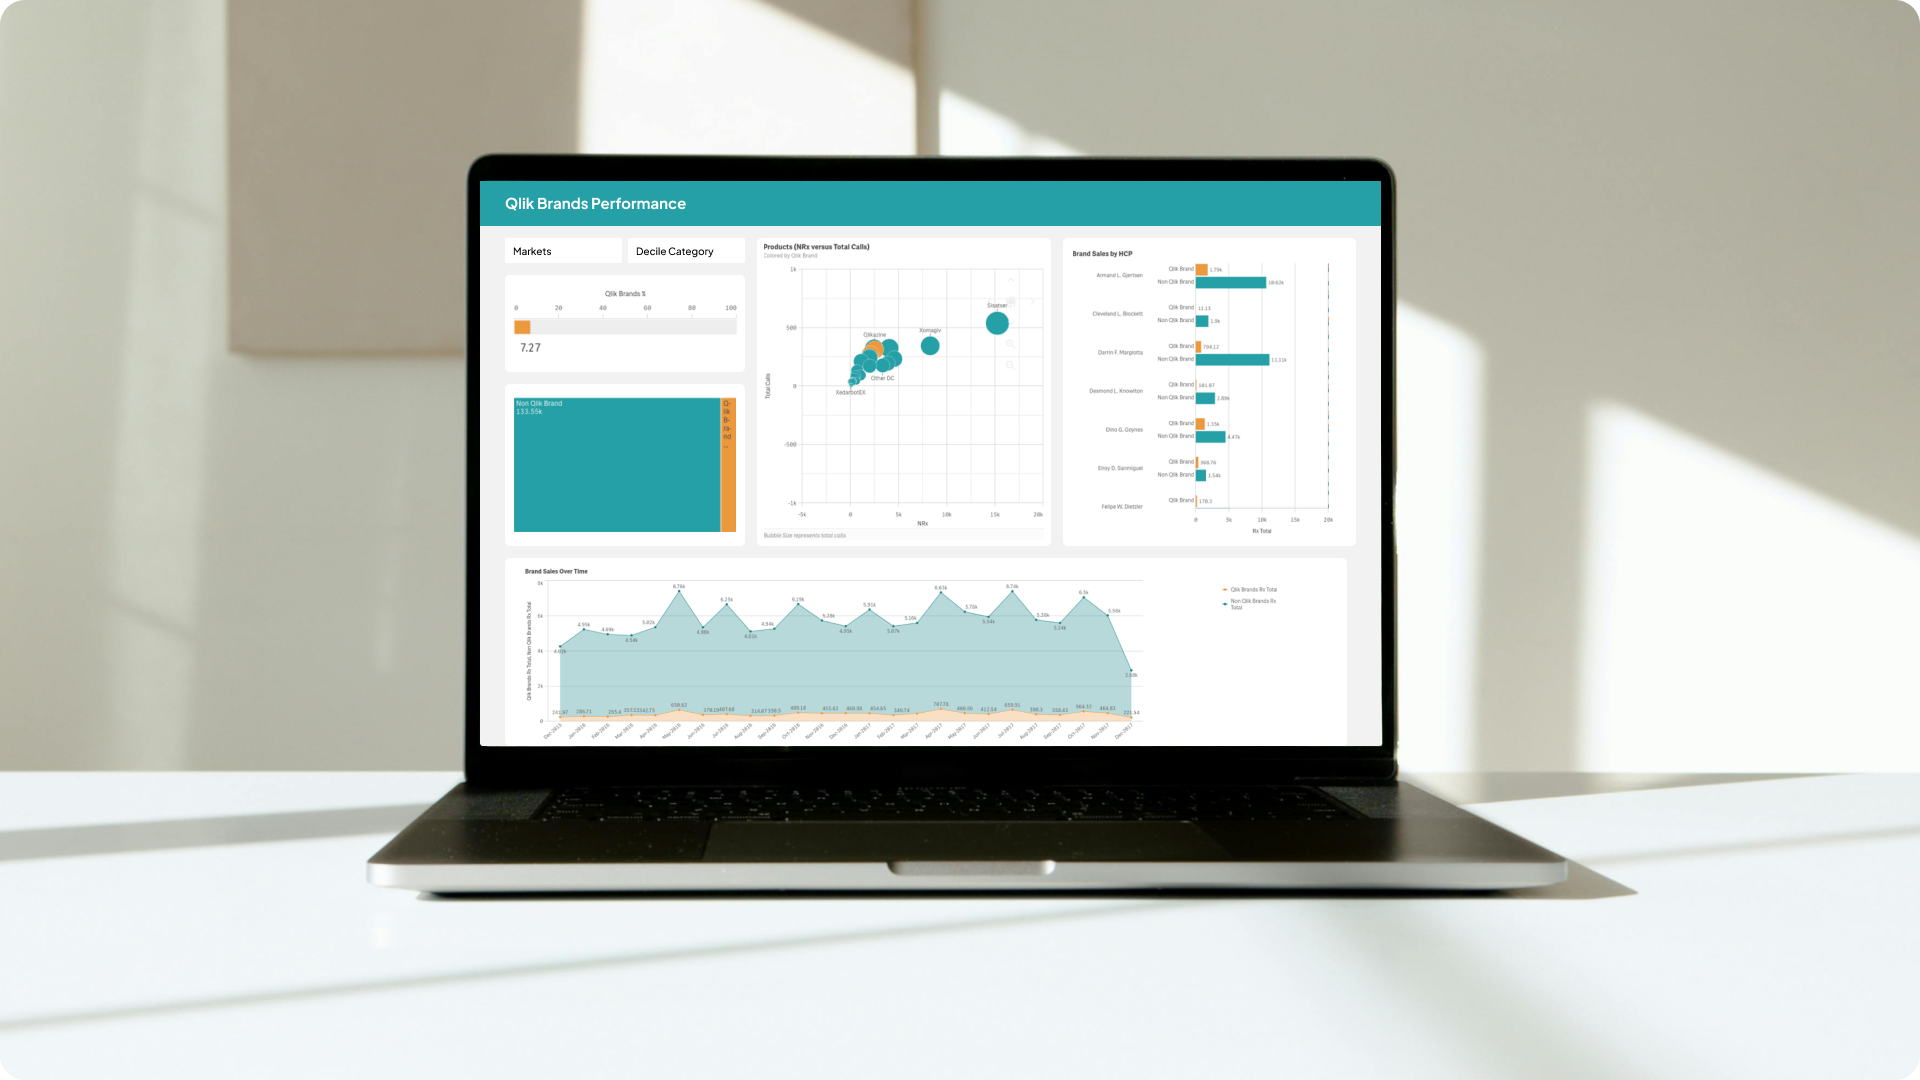
Leveraging data to
outpace competitors
- Industry: Healthcare
- Country: USA
The goal of developing a pharmaceutical sale is to use data analysis and strategic planning to improve the market share and sales performance of the Qlik Branded product within the pharmaceutical industry. This involves comparing the product against competitors across various important factors like healthcare professionals (HCP), market segments, and product categories to identify opportunities for growth and optimization.
The core challenges
- Data overload: Condensed large datasets into actionable insights through data aggregation and summarization techniques.
- Interactivity complexity: Designed intuitive user interfaces with clear navigation paths and consistent interaction patterns.
- Data inconsistencies: Implemented data validation processes to identify and correct inconsistencies or missing data points.
- Limited customization: Users could change some things to fit their needs, like making their own dashboards, saving views users like, or creating their own measurements.
Solution We have developed an advanced data visualization tool tailored to represent complex data in an easily understandable format.
-
 Visual hierarchy: Established a clear visual hierarchy by prioritizing important metrics and insights, using techniques such as size, color, and position to guide users attention to key information.
 -
 Interactive data exploration: Developed interactive visualizations that allow users to explore data dynamically, enabling them to drill down into details, filter datasets, and interact with charts for deeper insights.
 -
 Tailored user experience options: Offered customization options such as customizable dashboard layouts, user-defined filters, and personalized data views to accommodate diverse user preferences and analytical needs.
 -
 Real-Time data integration: Users connected to live data sources to get the most recent information about how well pharmaceuticals are selling. This helps salespeople keep track of what's happening in the market right now, so users can make quick decisions and take advantage of opportunities as users come up.
Integration.
Equipped with a variety of
chart types.
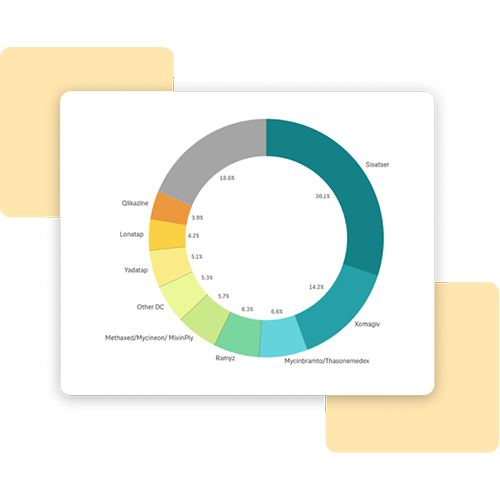
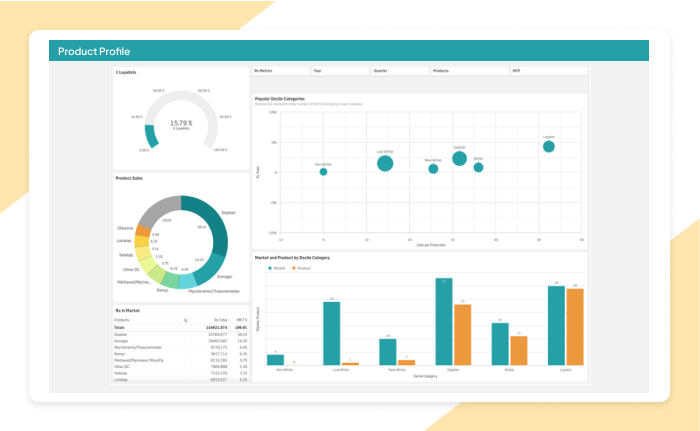
Integrates various chart types, offering a comprehensive view of pharmaceutical sales trends. These visualizations aid in informed decision-making and strategic planning for improved sales strategies.
- Bar chart
- Scatter plot
- Line chart
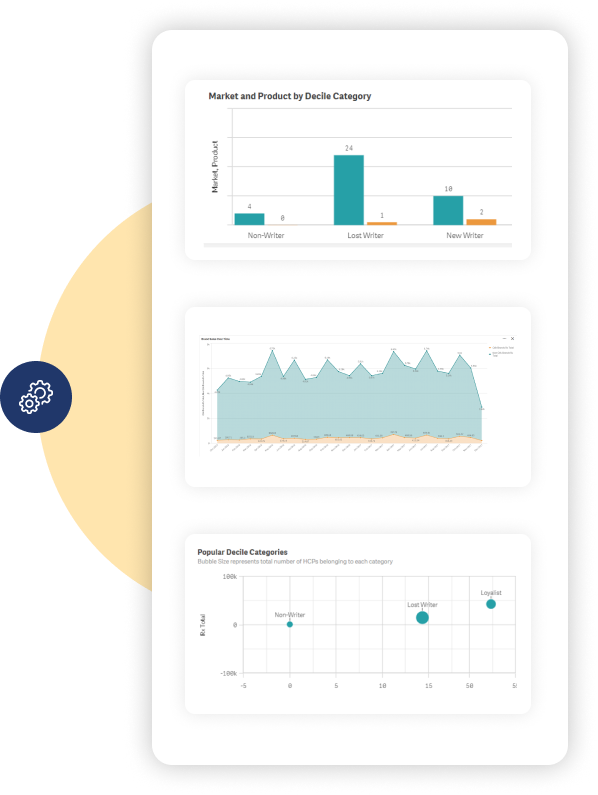
Customization.
We've tailored them to optimize data visualization. By customizing each chart to align with its unique characteristics, we ensure precise representation of data, enhancing insights and usability.
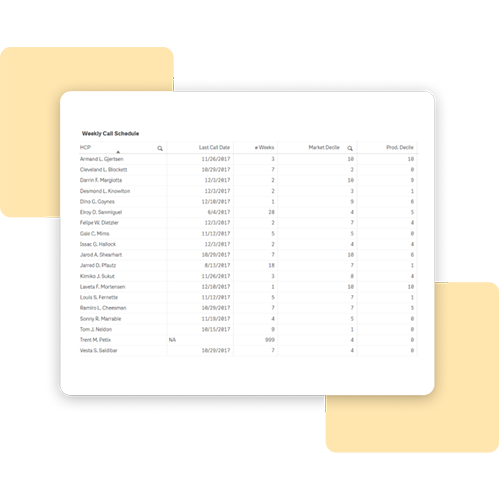
Data transformation algorithm
Developing a specialized algorithm, we transform raw data to fit the specific of each chart. This optimization ensures that charts accurately and meaningfully represent underlying data, facilitating clearer analysis and decision-making.
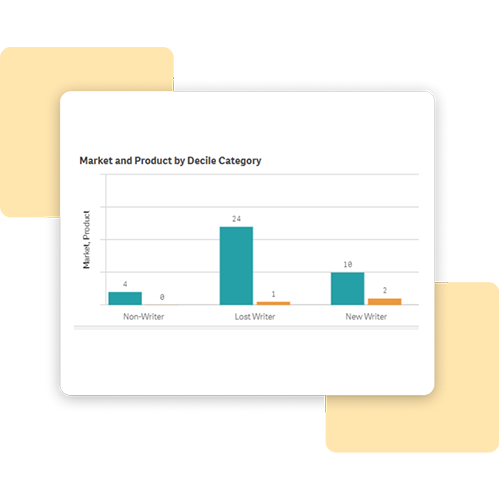
Color palette algorithm
Our dynamic color palette algorithm adjusts chart colors based on underlying data values. By automatically adapting colors, the algorithm ensures consistency and clarity, enhancing visual appeal and understanding of chart data.
Min-Max adjustment algorithm
Our min-max algorithm ensures visibility of all bars in charts. By adjusting bar representation, even when values vary significantly, the algorithm maintains accurate and comprehensive data visualization.
Enhancement.
By adding useful features.
Tailored dashboards
Implemented customizable dashboards allowing pharmaceutical sales teams to personalize their interface. Users can select and arrange charts, graphs according to their preferences.
Dynamic bookmarking
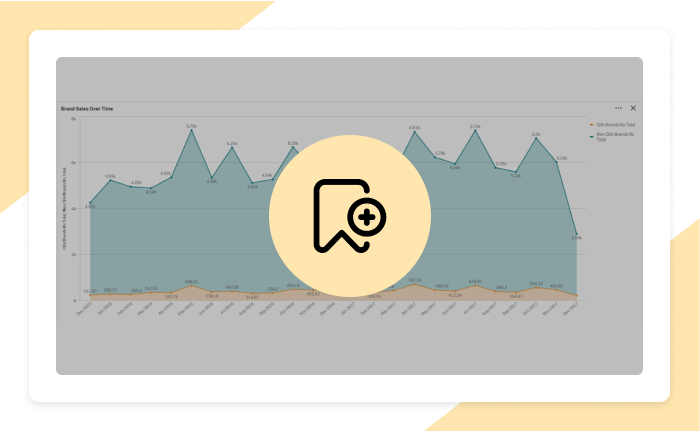
Users to save and revisit specific data Selections, filters, and dashboard configurations. This feature preserves analysis states, fostering collaboration among sales teams and facilitating decision making based on historical insights.
Data storytelling tools
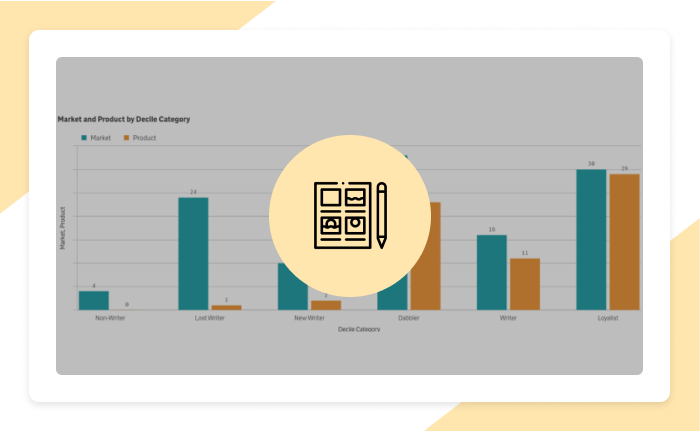
Users got tools to make exciting stories about sales data in pharmaceuticals. With pictures, notes, and writing combined, users could explain the data easily, helping the sales team understand and act on it.
Explore more.
Additional features.
Hierarchical filtering. Implemented hierarchical filtering capabilities, enabling users to drill down into data at different levels of granularity. For example, users can start with an overview of sales performance at the national level and then drill down into specific regions, districts, or individual healthcare facilities for deeper insights.
Interactive dashboard. Build interactive dashboards in Qlik Sense that feature intuitive filtering options, enabling users to interact with visualizations and dynamically update data views based on their filter selections.
Export preferred charts/KPIs. Users are provided with a user-friendly interface to effortlessly select the charts and KPIs they wish to export from the Pharma Sales Qlik Sense app.
