Innovative dashboard solutions for smarter operations.
- Industry: eCommerce
- Country: India
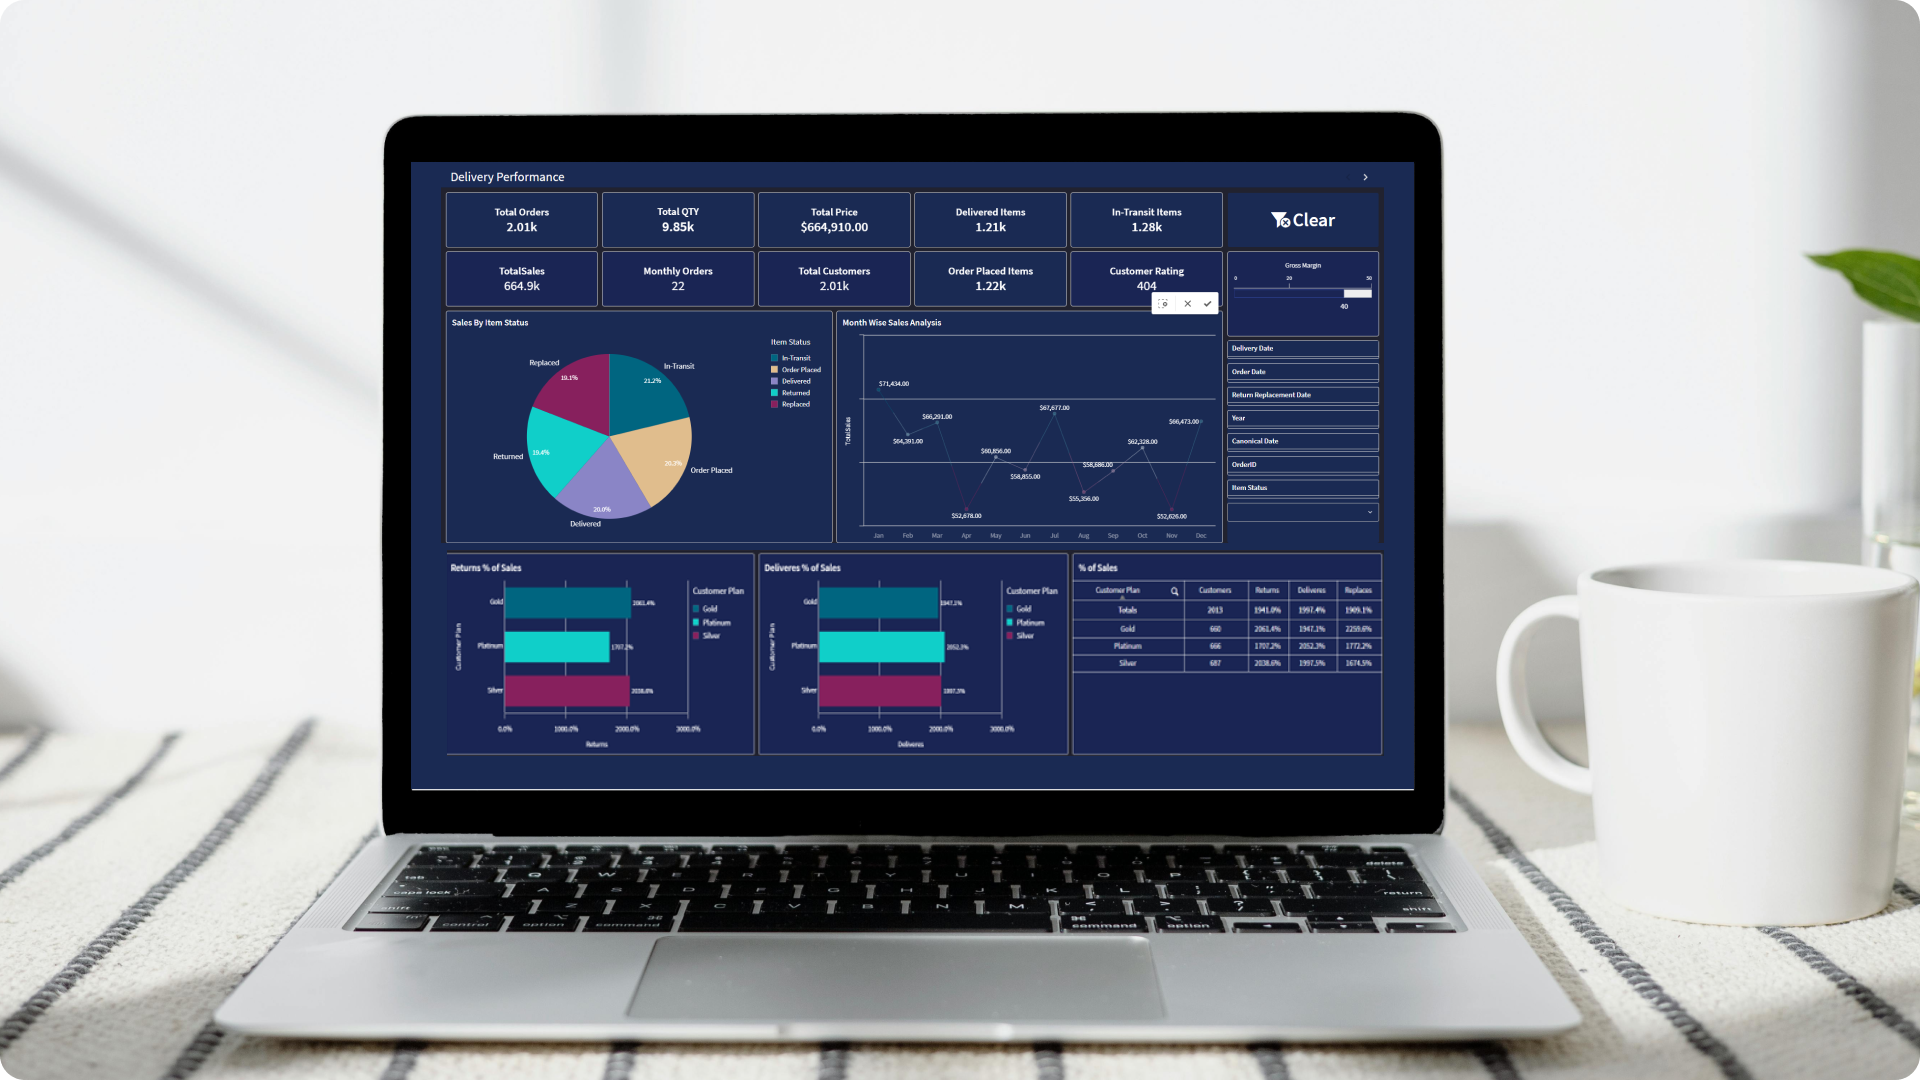
The goal of this project is to analyze e-commerce order data to extract valuable insights that will help optimize business operations and enhance customer satisfaction. This will be achieved by developing a comprehensive, interactive dashboard that provides actionable insights and supports data-driven decision-making.
The core challenges
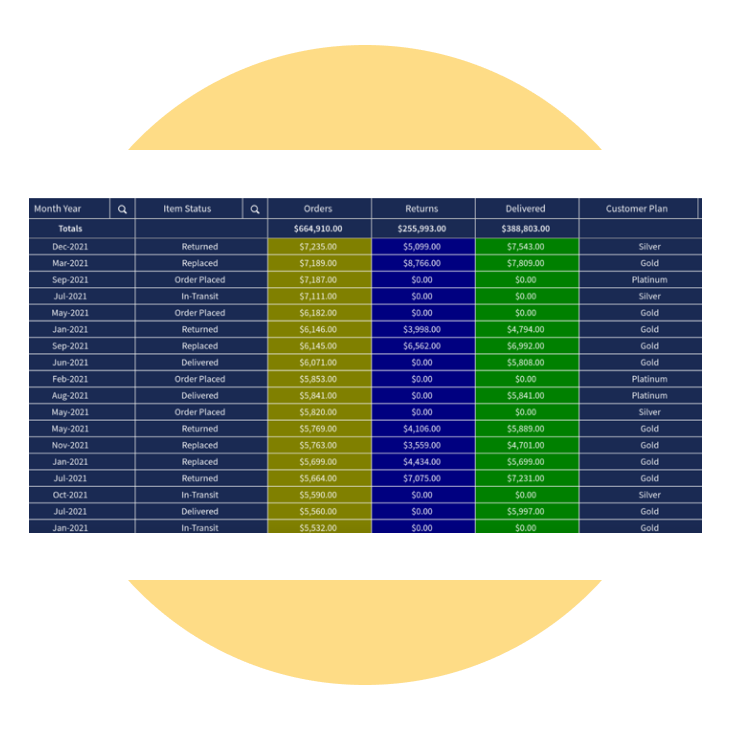
- Data quality and consistency: Making sure the data is accurate and consistent, especially for things like order status and delivery dates. Clean and standardize the data to fix any errors and fill in missing information.
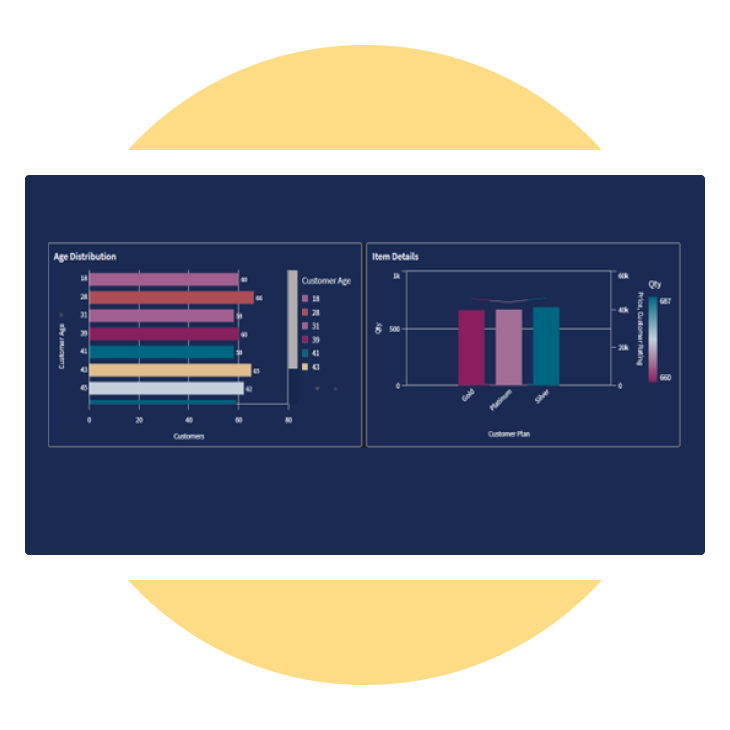
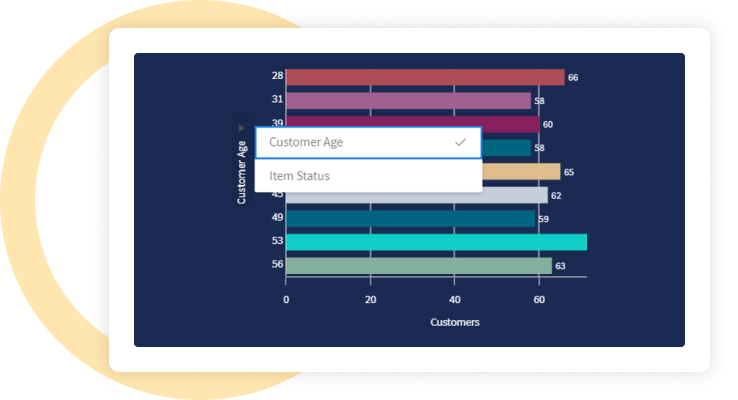
- Customer segmentation: Grouping customers based on their age, plan, and buying habits to improve marketing. Use grouping techniques to identify and target different customer types.
- Order fulfillment and delivery: Understanding and improving how long orders take to fulfill and how often they are returned. Track key metrics to find and fix delays in the delivery process.
- Product performance: Figuring out which products are popular or not, and how they are received by customers. Analyze sales and feedback to better manage inventory and product selection.
Solution We've created an advanced data visualization tool that simplifies complex data, making it easy to understand and interpret.
-
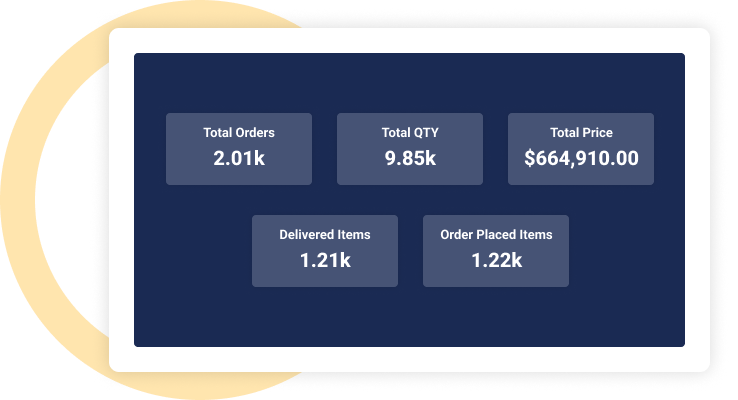
 Visualization and dashboards: Design interactive dashboards that highlight key metrics and trends, making data easy to monitor and analyze. Use various visual tools like charts, graphs, and maps to effectively convey insights.
 -
 Data integration: Build a comprehensive data integration framework to unify and combine data from various sources into a single, easily accessible platform.
 -
 Embedded reports: Integrate reports directly into your applications or dashboards, allowing users to view and interact with data insights within their workflow without needing to switch between different tools.
Integration.
Equipped with a variety of
data sources.
- Flat files
- QVD Files
- SQL
- Oracle

Customization.
We’ve customized each chart to enhance data visualization, aligning them with specific characteristics for accurate representation. This tailoring improves both insights and usability.
Color schemes
Applying color schemes that enhance readability and highlight important data points or trends.
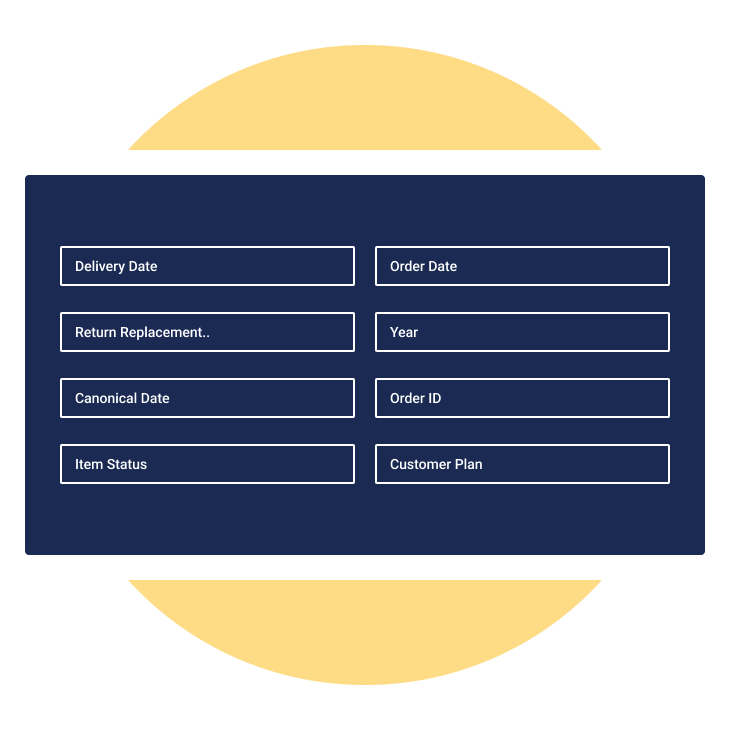
Filters and interactivity
Incorporating interactive elements such as filters and drill-downs to allow users to explore data more deeply.
Layout and design
Adjusting the layout and design of charts and dashboards to improve visual appeal and user experience.
Enhancement.
Custom KPI design
Design custom KPIs using Qlik Sense’s KPI design options to align with specific business objectives and user needs.
Interactivity
Add interactive elements like tooltips, drill-downs, and hover effects to provide additional details and enhance the dashboard's usability.
Explore more.
Additional features.
Interactive dashboards. Enables users to delve into more detailed layers of information and context. This functionality allows for dynamic exploration of data by clicking through visualizations. As a result, users can uncover deeper insights, analyze trends, and identify patterns more effectively.
Customizable widgets. Users adjusted their dashboards by adding and arranging different elements to fit their needs. This customization helped them create a view that worked best for them, making the dashboard more useful and easier to use.
Export preferred charts/KPIs. Users are provided with an intuitive interface that allows them to easily select and export their preferred charts and KPIs from the Customer Qlik Sense app. Export to PDF, QVF files


