Dynamic dashboard to analyze productivity and growth.
- Industry: FinTech
- Country: USA
Our goal is to deliver a dynamic dashboard tailored for the financial industry, providing specialized business intelligence. We've developed a financial smart dashboard featuring easily interpretable graphs and data. This enables finance organizations to achieve strategic growth, streamline decision-making, and increase productivity through dynamic data analysis.
The core challenges
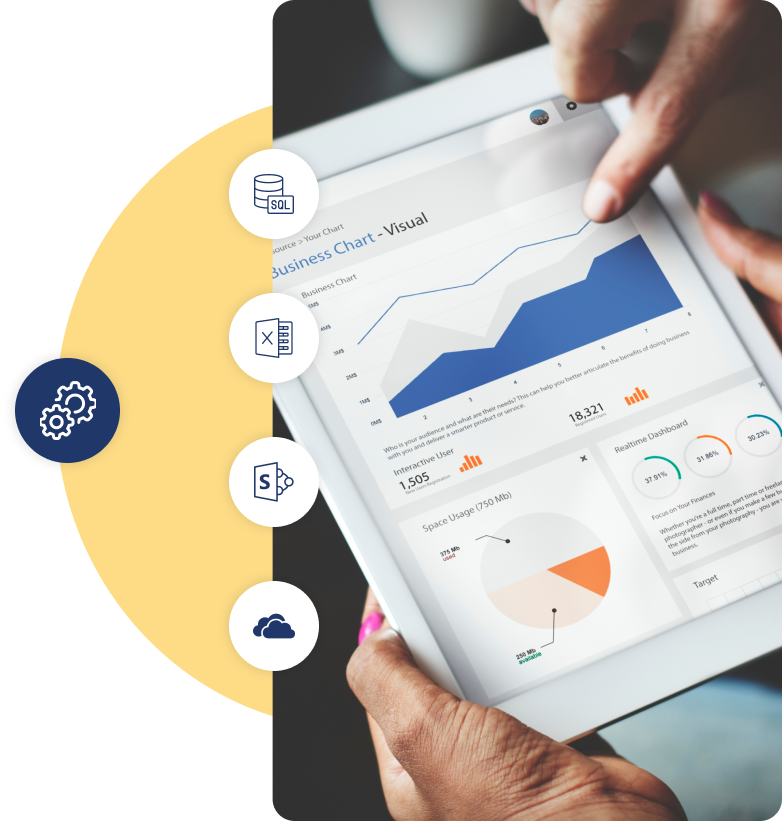
- Data integration: Integrating data from multiple sources, such as SharePoint folders, MySQL dumps, Excel spreadsheets, OneDrive, and various Learning Record Store (LRS) storages, can be complex. We transformed and consolidated the data to overcome this challenge.
- Usability and user adoption:The original reports were likely difficult to read, visually cluttered, or lacked a clear information hierarchy. To address this, we redesigned the dashboard to focus on simplicity, clarity, and intuitive navigation, improving usability and encouraging user adoption.
- Data privacy and security: Protecting sensitive financial data is crucial. We implemented Row Level Security (RLS) to filter and safeguard sensitive data, ensuring confidentiality and enhancing security.
- Performance enhancement: Dashboards can become slow due to excessive information and complex calculations. To maintain efficiency, we optimized the data model and report layout.
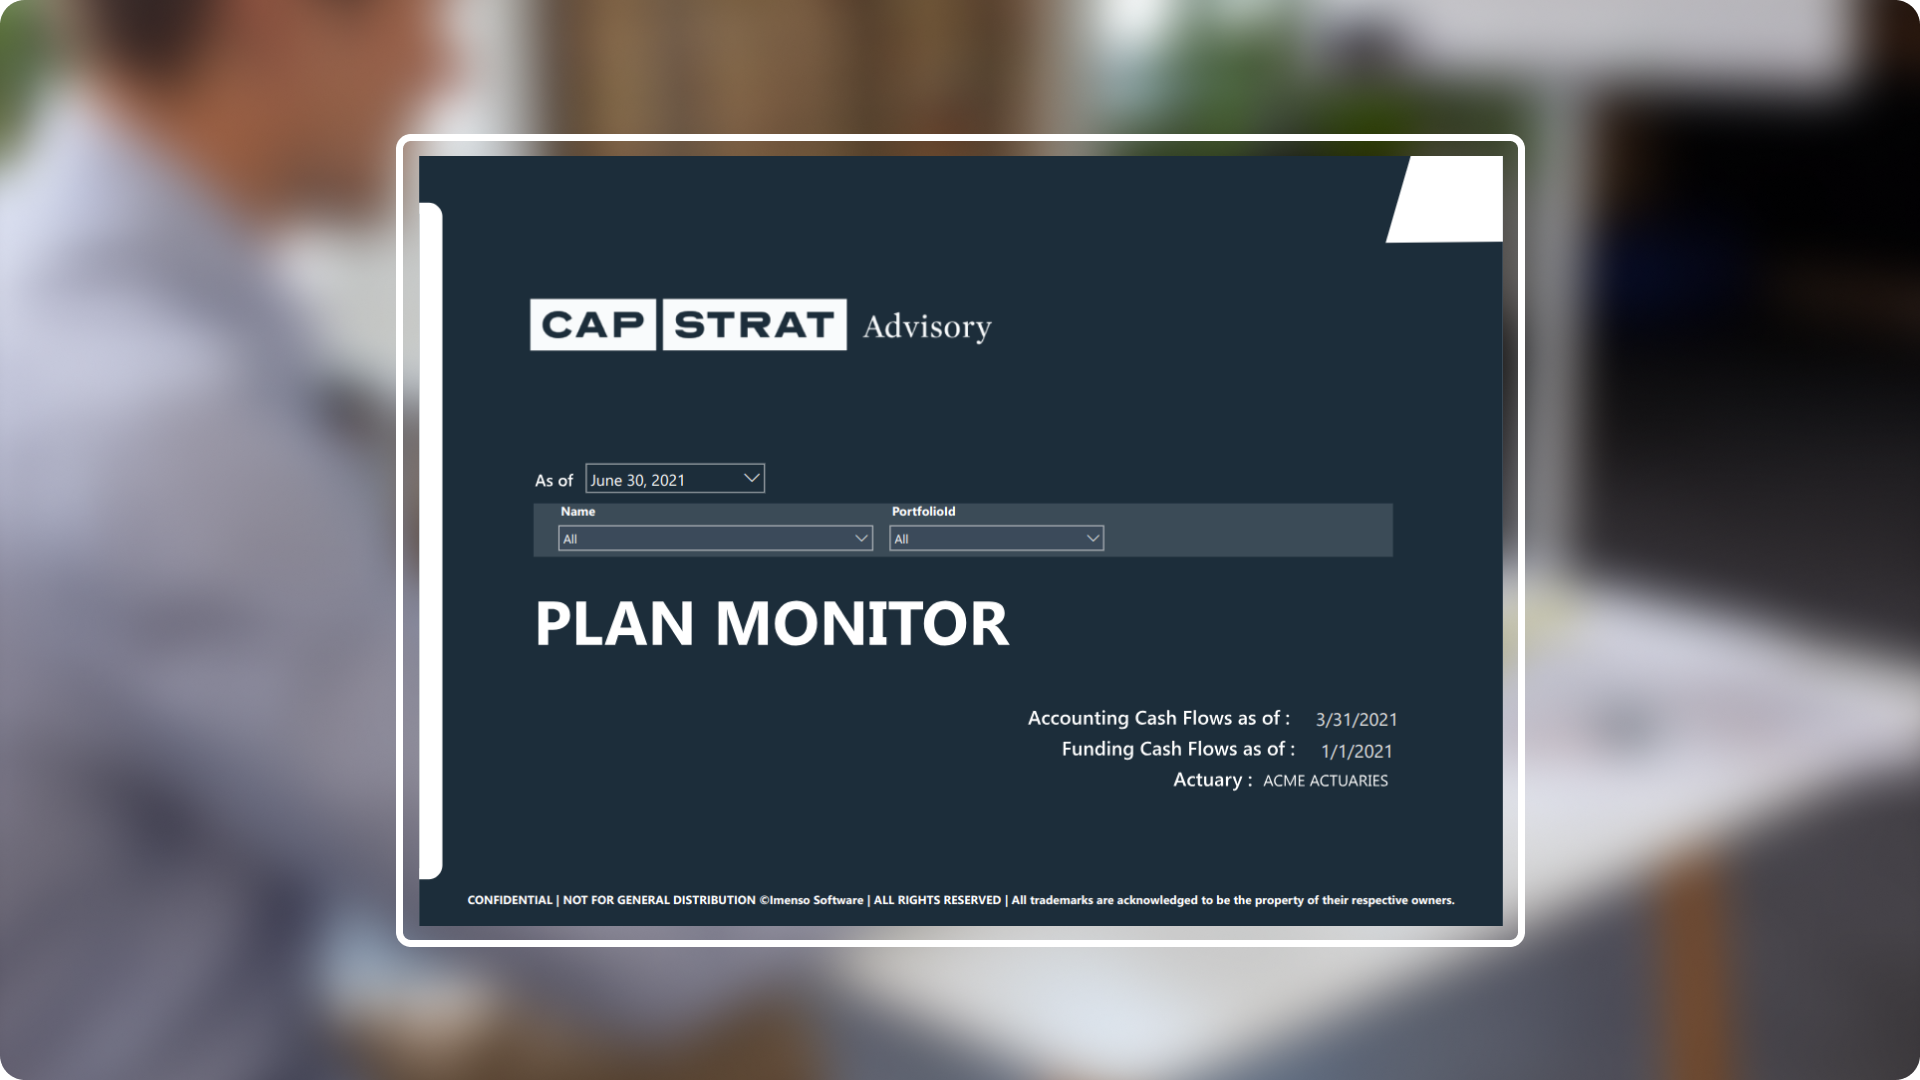
Solution We have developed a cutting-edge data visualization dashboard specifically for the financial sector, designed to present complex operational data in a clear and intuitive manner. This solution includes a comprehensive set of charts and visualizations tailored to financial data, enabling professionals to easily analyze and interpret critical information.
-
 Gauge charts for targeted analytics: We utilize gauge charts to provide accurate forecasts of accounting performance, deficits, and premiums earned, leveraging historical data for precise analytics.
 -
 Row-Level security (RLS): To enhance data security, we implement Row-Level Security (RLS), which filters data based on predefined criteria, ensuring that sensitive information is accessible only to authorized users.
 -
 Enhanced user interface: The user interface is meticulously designed to enhance accessibility and usability, featuring improved navigation and interactive elements tailored for financial industry professionals.
 -
 Embedded reports: Our solution allows for the embedding of reports and dashboards into custom applications or websites, expanding the reach and usability of financial insights.
 -
 Data modeling: We employ robust data modeling techniques to effectively organize and structure data, maximizing the analytical and visualization capabilities within Power BI, ensuring comprehensive insights and data-driven decision-making.
Integration. Equipped with a variety of data source.
- SQL Server
- SharePoint
- One Drive
- Excel Spreadsheets
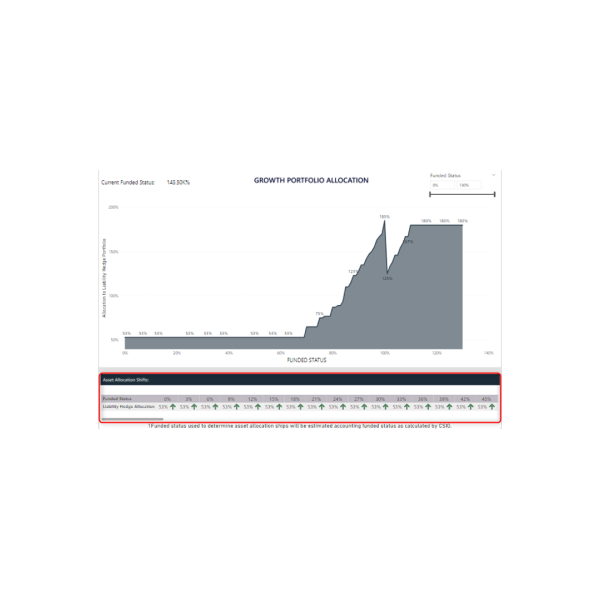
Customization. How we played with charts?
In order to effectively display the data, we did more than just add charts; instead, we gave each one a unique design that served its intended function.
Conditional formatting
Dynamic adjustments, like altering the background of rows according to certain criteria in the cell value of the matrix.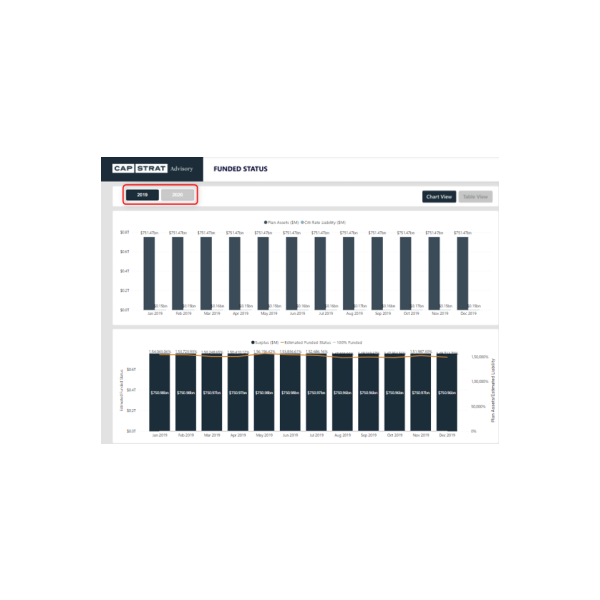
Custom slicer
Created a special slicer where we included multiple values, Chiclet Slicer supports batch ticking directly and cross highlighting on visual.Enhancement. By adding useful features.
Synchronizing slicers
With synchronized slicers on every page, users can easily browse the data and maintain uniform filtering across various representations, enabling a seamless analytical experience.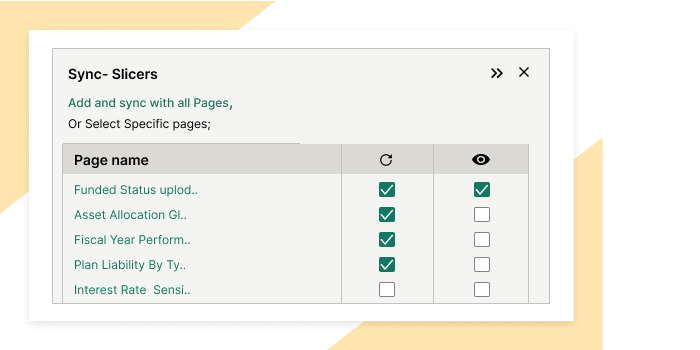
Page and visual level filters
Utilizing both page and visual level filters, users can now filter pages and visuals according to specific requirements, ensuring a customized viewing experience.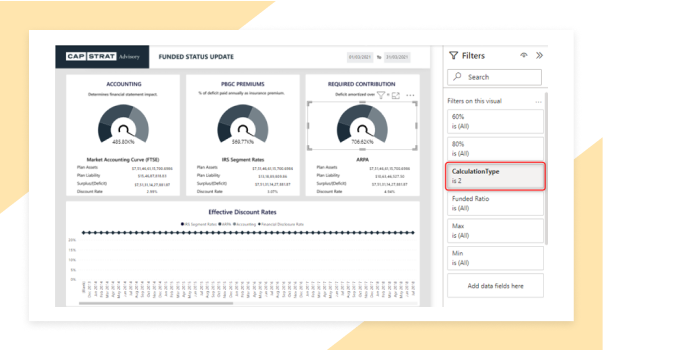
Bookmarks
With bookmarks, users can easily navigate between several chart representations inside the same canvas by selecting different actionable buttons. This allows for dynamic chart displays.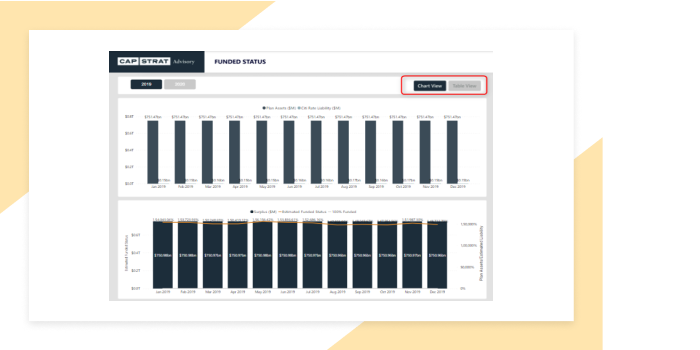
Dynamic visualization techniques
Adding different kinds of charts, like line and cluster columns, stacked bars, areas, pie, donuts, and cards, makes the dashboard look better and makes the user experience more interesting and immersive.