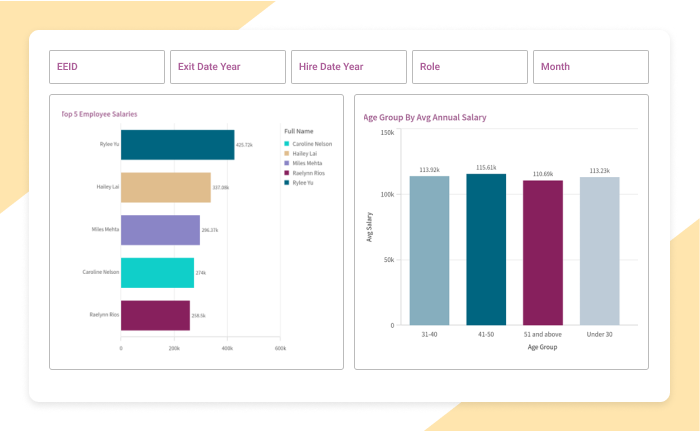
Comprehensive dashboard for employee insights
and progress.
- Industry: Human Resource
- Country: USA
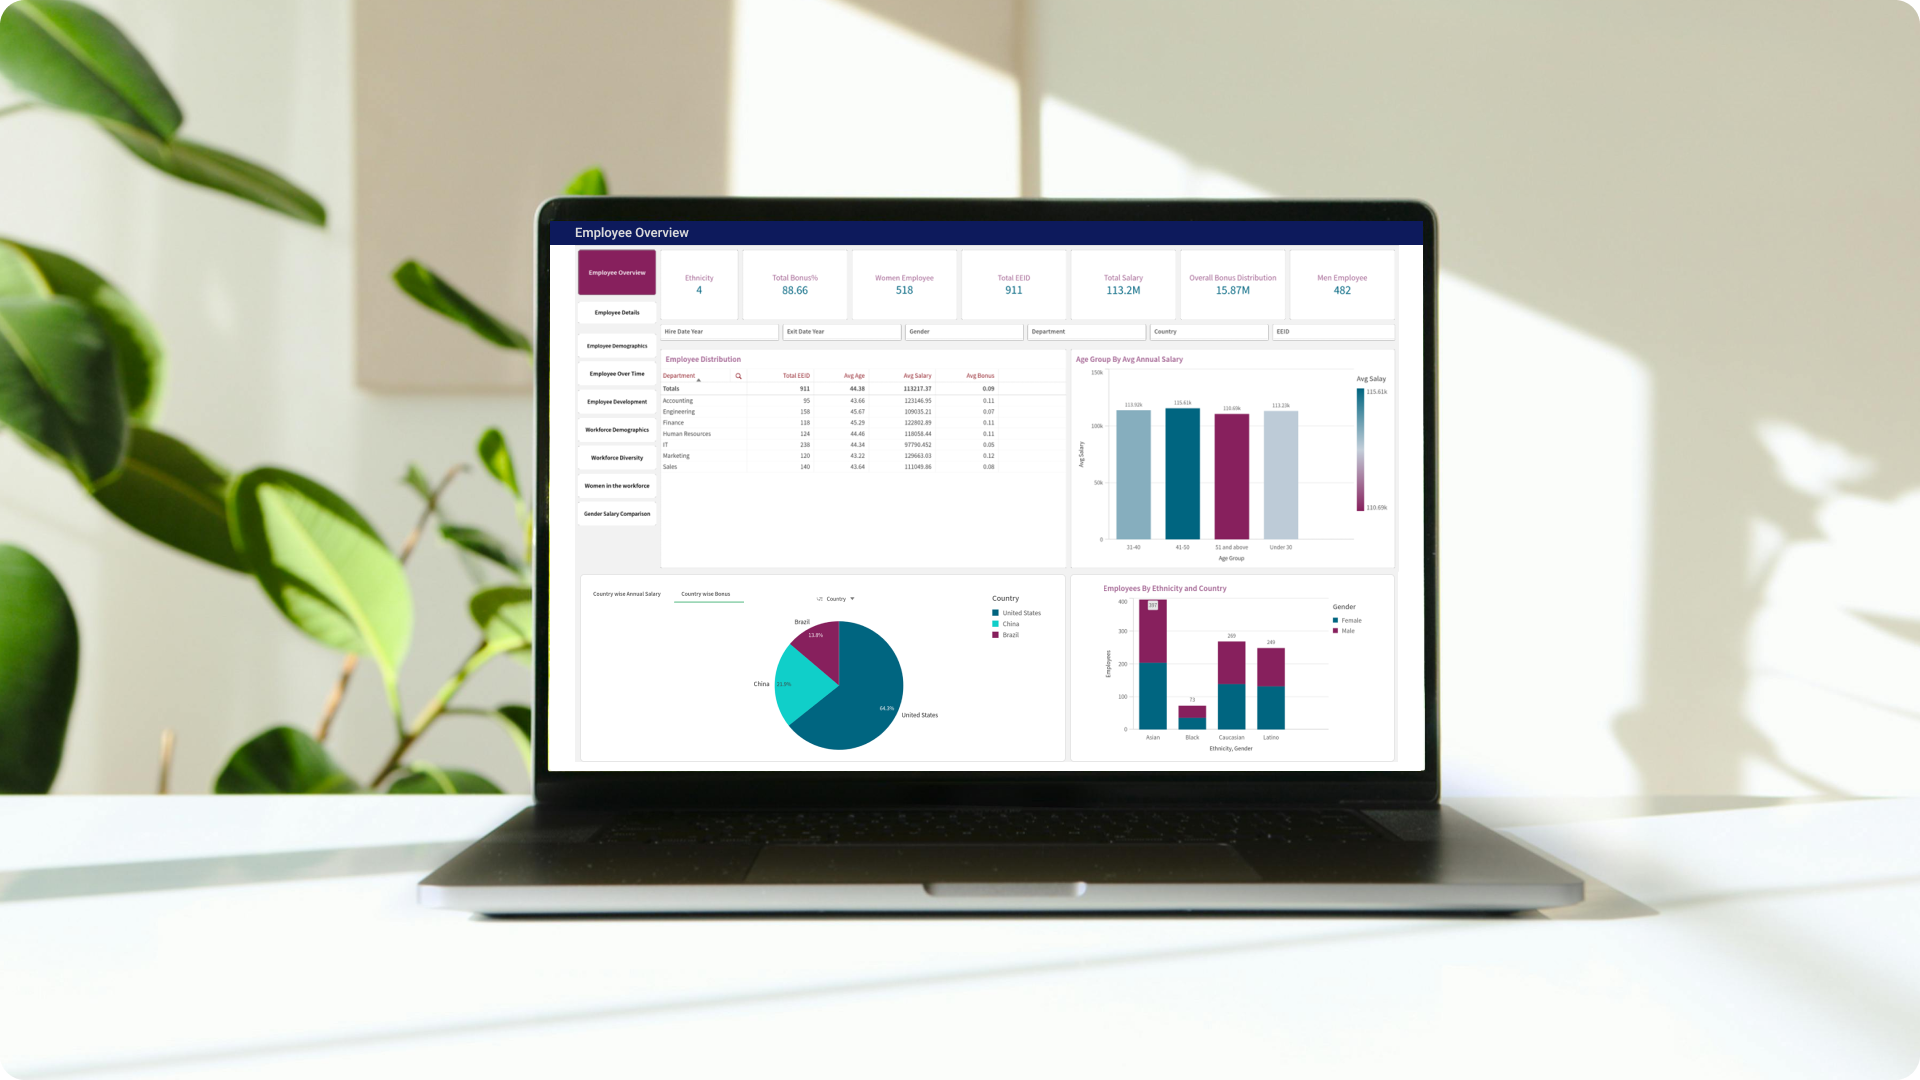
The goal of the employee dashboard is to offer actionable insights into employee productivity and performance trends. This helps managers make informed, data-driven decisions to improve team efficiency, identify areas for improvement, and align workforce performance with organizational objectives, ultimately driving business success.
The core challenges
- Customizable performance : Provided options for users to select which measurement they want to display on each chart or table, and allow them to customize the appearance of these visualizations, such as colors and styles, just like customizing sheet.
- Hierarchical filtering : Created a filter panel, where users can refine data by department, team, or individual,Like creating a filter hierarchy in a pivot table.
- Transforming insights into action: Addressing the Challenge of Actionable Decision-Making in Employee Performance management with Qlik Sense
Solution We have developed an advanced data visualization tool tailored to represent complex data in an easily understandable format.
-
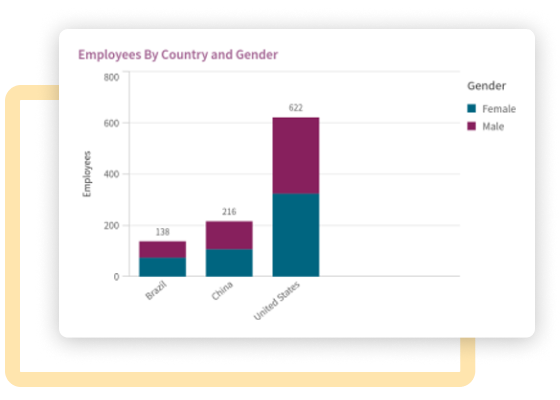
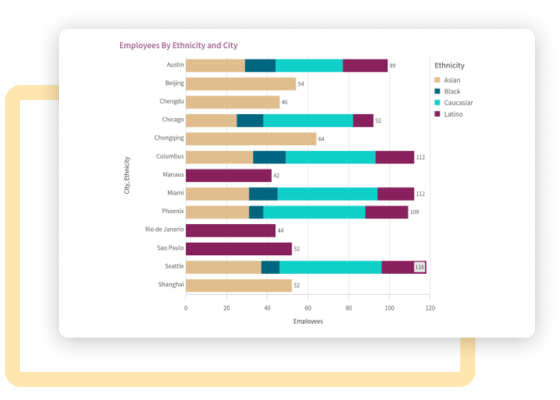
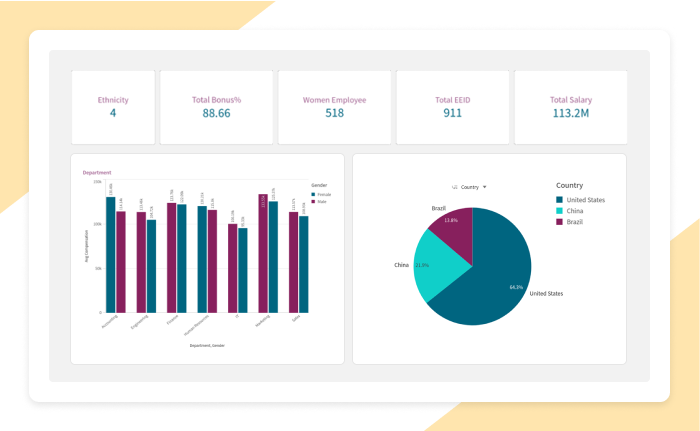
 Visual representation : Used different types of charts to show how well employees are doing at work in a way that's easy to understand and looks good, helping people make sense of the information.
 -
 Data centralization and accessibility: Set up a strong system to keep all the information about how employees are doing in one place, making it easy for everyone to find and making sure the information is the same everywhere it's used.
 -
 Tailored dashboard presentation: Offered customizable dashboard layouts, allowing users to personalize their view by selecting preferred charts and key performance indicators (KPIs).
 -
 Intuitive chart organization: Users moved charts and key performance indicators (KPIs) around on the dashboard easily by drag-and-drop functionality, preserving user-defined layouts.
 -
 Embedded reports: Our solution lets you embed Qlik Sense reports and dashboards directly into your custom apps or websites. This makes it easier for users to access and use financial insights right where they’re working.
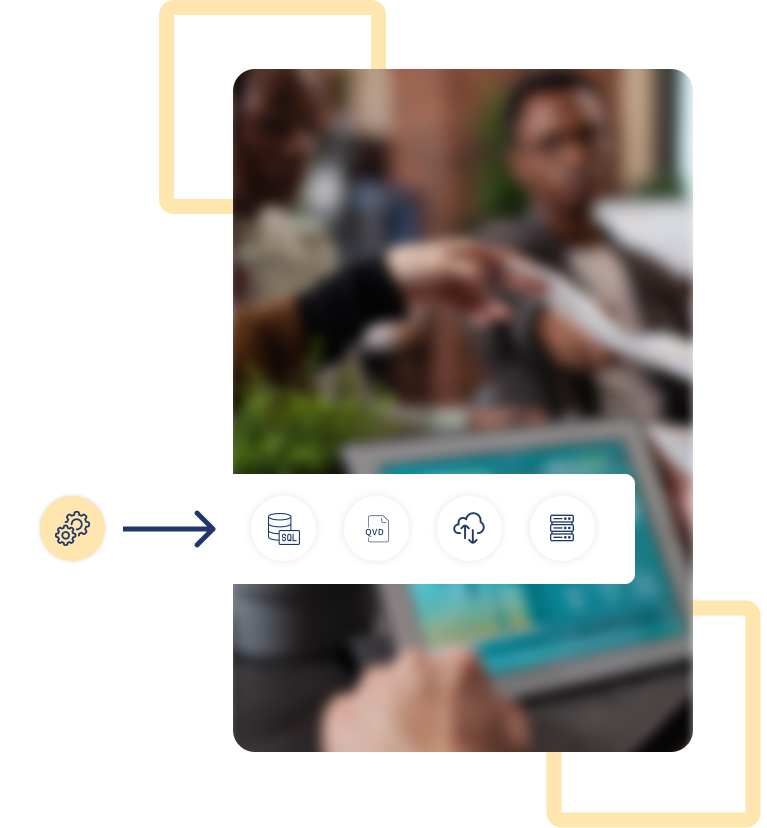
Integration.
Equipped with a variety of
data sources.
- Flat files
- QVD Files
- SQL
- Oracle
Customization. How we played with charts.
We made special formulas to change the raw data about how employees are doing into formats that each chart needs. This way, the charts show the performance trends accurately and are easier to understand.
Data transformation
Applying color schemes that enhance readability and highlight important data points or trends.
Color palette adjustment
We created formulas that automatically change the colors in charts when employee performance changes. This makes it easier to see trends clearly in the visualizations.
Min-Max adjustment
To make sure that all employee performance data, no matter how big or small, shows up clearly on the charts. This helps avoid important details getting lost, especially when some values are much bigger than others.
Custom report templates
Users pick which performance details they want, arrange the data how they like, and decide how the finished report looks.
Enhancement. By adding useful features
To elevated the application and provided an enhanced user experience, to make the app better and give users a nicer time, we added features that users interact with charts and data easily.
Personalized layouts
Users to created and save their own layouts by picking the charts and KPIs they like. This helps quick access to relevant performance insights.
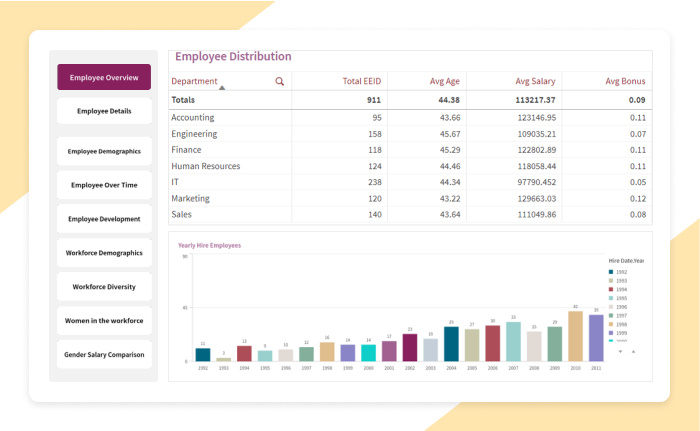
Buttons
Buttons help users easily move between important sections of data, like Employee Details, Employee demographics, it makes simpler and faster to use the app.
Advanced filters
Added advanced filtering capabilities to apply multiple levels of filtering, users to refine performance data based on specific criteria such as department, time period, or performance category.
Explore more.
Additional features.
Customizable filter configurations. Users to customized and save filter configurations for future use, allowing them to streamline data analysis and access frequently used filter settings effortlessly.
Easy-to-Read reports. Generated simple, clear reports summarizing employee performance metrics, making it easy for users to understand and act upon the insights provided.
Export preferred charts/KPIs. Users to save and share their preferred charts and key performance indicators (KPIs) with others, fostering collaboration and knowledge sharing. Export to PDF


