Top Use Cases of Data Visualization Dashboards in Healthcare
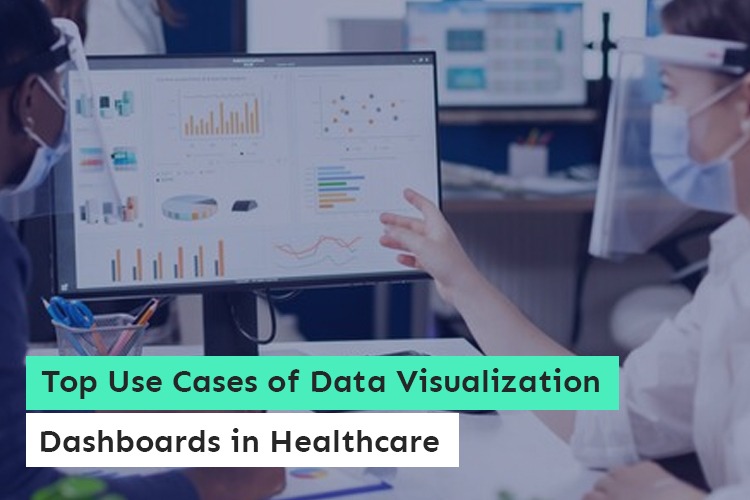
The human eye is naturally drawn to pictures more than text lists. Therefore, it is not an exaggeration to claim that data science visualizations in healthcare are essential for saving lives. The healthcare sector is being shaken up by big data. Simply put, data visualization is the practice of displaying data graphically, such as through charts and graphs.
The healthcare analytics market is predicted to be worth USD 40.781 billion by 2025, which comes as no surprise. Instead of reading through thousands of rows in a spreadsheet, we can just glance at a visual representation of the data and immediately see recurring patterns and trends.
Data Visualization in HealthCare: Overview
Data visualization, the process of analyzing large datasets and presenting the findings visually, is a popular tool in the modern big data era. Massive corporations like Amazon and Apple use information and data visualization to make better business decisions and get the most out of their operations.
The healthcare industry is exploring data visualization to improve productivity and draw attention to significant medical breakthroughs. Data visualization allows a hospital to track not just the well-being of its patients but also the costs, efficiency, and satisfaction of its clients.
The role of a business analyst is to ensure the effective use of data visualization methods in the healthcare industry. Finding and reporting on KPIs requires analysts with strong communication skills, a propensity for detail-oriented study, and a strong data-driven orientation.
Hospitals are just starting to realize the value of massive volumes of data, so they must accelerate their use of data visualization in healthcare by taking help from a data visualization developer.
Health Care Prediction and Prevention Using Visualization
Although it is impossible to know what the future holds, the healthcare business has access to several data analytics tools like Microsoft Power BI that can help professionals deal with past and prospective diagnoses. Descriptive analytics is one such method, as it looks at previous data and how it has functioned, behaved, and related to the topic at hand (in this case, diagnosis).
In contrast to diagnostic analysis, which aims to discover the reasons behind the occurrence of certain diseases and explain their origins, the predictive analysis uses past data to make predictions about what conditions might arise in the future, serving as a type of prevention.
Also Read: How Data Visualization Is Improving Healthcare Decision-Making?
Prescriptive analysis is used to help medical professionals weigh their options and make educated decisions. Data-related subjects like data visualization are essential beyond monitoring health since they help doctors foresee and explain the origins of potentially dangerous conditions and past illnesses.
Healthcare Data Visualization: Its Benefits

- Healthcare Coordination
The availability of data has increased alongside these developments in patient care. Data visualization technologies have made it much easier for healthcare practitioners to collect and analyze large amounts of data concisely and add new data sets to existing visualizations for deeper analysis.
The display of data simplifies patient care information, allowing nurses to interpret research better and apply what they’ve learned. Healthcare providers can use information from previous patients with the same symptoms to understand how long it usually takes for people to recover.
- Establishing Regularities
Many new insights can be gained through visualizing massive amounts of complex data. Business users can gain a deeper understanding of the data and the links between it by using data visualization.
In a business setting, examining these tendencies helps users zero in on specific data needs. These aid people in grasping the significance of certain regions, which is crucial for advancing the organization through the necessary efforts.
- Enhanced Capacity for Analysis and Comprehension
Creating a compelling narrative is the goal of your dashboard. By carefully crafting the visuals, you assist the intended readers in grasping the story’s core ideas at a glance. Use only the minimum amount of complicated images that are absolutely necessary to convey the tale.
Revenue, marketing efforts, and product interest may all be evaluated with the use of data visualization by a company’s stakeholders. Based on the study’s findings, they will allocate resources to the areas where they will significantly impact the company’s bottom line. Therefore, not only can you better comprehend and evaluate the data, but you can do so with the help of data visualization.
- Comprehending Current Trends
Data visualization aids the company’s trend-spotting efforts by fostering a deeper comprehension of the data and more precise analysis. Data visualization will help you discover the latest trends in your market, allowing you to provide superior solutions and anticipate problems.
This assures efficient operations and keeps you abreast of industry developments, allowing you to devote more time and energy to expanding your business.
- Recognizing Flaws
Data visualization is effective enough to detect errors because it can reveal emerging business trends and other changes. Data mistakes can be quickly identified with the use of data visualization. It’s much simpler for the user to take the necessary steps and exclude the data if it looks to indicate improper behavior.
- Quick Actions
Since the human brain processes pictures much faster than it processes data in a tabular format, it is clear that visuals are preferable. Business growth is facilitated by data visualizations because they make it simple for decision-makers to gain access to and act on fresh data insights. It shortens the time it takes to complete tasks and reduces the amount of time spent planning and strategizing.
- Public Health
Evaluation of the effect on public health and the need for implementation can be done in a number of ways in the era of big data, thanks to the availability of numerous interactive visualization tools. When properly visualized, big data can aid in identifying implementation inequalities and gaps.
This can help get life-saving interventions out to the people who need them the quickest. To be truly effective, precision public health requires more efficient data integration and visualization methods and better predictive analytics.
Also Read: Top 9 Best Power BI Dashboard Examples For 2022
Health administrators may come from a wide range of backgrounds, and the vast majority, including those with backgrounds in public health, will lack formal expertise in big data science. As a result, there is an immediate need for comprehensive training and career advancement opportunities in this area.
Data Visualization Tools In Healthcare

A data visualization tool can help any healthcare provider save a lot of money by making it easier to organize and retrieve patient and organizational details. We’ve included a list of some popular data visualization applications used in the medical field below.
- SAS Visual Analytics
SAS Analytics is a web-based application that allows several users to access a significant amount of data that is constantly being updated from the data loaded in the cache, i.e., the LASR analytic server, simultaneously. These servers provide parallel networking, shifting the load from one computer to another, allowing users to access encrypted data quickly.
- Tableau
It is a visualization tool for business intelligence that takes in data in an unstructured form and outputs structured information in near real-time. Since the data may be updated in real-time, users can immediately generate new insights. Inova Healthcare, a prestigious Virginia-based NPO, uses Tableau to aid in the rapid diagnosis of genetic diseases and the provision of timely care to those who suffer from them.
- QlikView
When Qlik, a business intelligence visualization tool, is used to send data into electronic medical records, it is possible to identify and communicate data sets that are related in some way. Its in-memory analysis helps with data integration from several sources, and it reduces the price of patient care while increasing patient safety and reducing the likelihood of medical mistakes.
QlikView‘s scheduler server keeps track of all patients and doctors and communicates that information to the user applications on both ends, ensuring that everyone’s schedules are in sync. As an added bonus, it ensures that all operational and patient safety indications are delivered and maintained promptly, as applicable regulations require.
Top Use Cases of Healthcare Data Visualization Dashboards
- Population Health Analytics
Healthcare professionals must supply patients with high-quality care that is also cost-effective. You can use this tool to classify patients into groups, evaluate the quality of care given to those groups, and then make plans to improve treatment for those groups. The tailored population health analytics solution’s late-binding data approach facilitates swift and accurate information extraction from various data sources.
Using sophisticated risk stratification algorithms, the patient population can be divided into those with high, moderate, and low health risks. This approach benefits from the ability to anticipate risk scores, tailor care regimens to individual patients, and analyze population health management trends.
Also Read: Telehealth Software: A Revolutionizing Technology For Healthcare Industry
It is also possible to conduct a population-wide risk assessment to zero in on subsets of the population who are likely to benefit most from primary prevention strategies (for example, those who are at high risk, those who have chronic diseases, and those who have not yet received these interventions).
The patient’s medical history may be viewed in one convenient location, including all of their diagnoses, hospitalizations, ER visits, discharge information, healthcare providers, and medications.
- Practice Management
Dashboards give doctors real-time access to patient information, allowing them to book appointments, manage their calendars, and keep tabs on scheduled tests and checkups. Healthcare practice management software keeps tabs on, controls, and improves the healthcare industry’s financial and administrative operations.
With the help of the intuitive task management tool, you will be reminded of important details at the right time, allowing you to interact better with your patients and provide them with high-quality treatment.
Reports generated by this practice management software are thorough and informative, covering many different aspects of patient care and outcomes and the services provided.
- Payer Claim Management
The time-consuming process of managing healthcare claims might be simplified with the help of specialized software. The system can automatically track bills, payments, and yearly deductibles thanks to its comprehensive and adaptable billing claim processing system with numerous models of claims integration.
This system streamlines claims status management by automatically receiving data from payers regarding claims’ approval, rejection, and denial. Healthcare providers can monitor performance in real-time and see the most common causes of claim rejections and delays on user-friendly and informative data dashboards.
- Medical Billing
A number of tasks go into medical billing, including checking a patient’s insurance coverage, creating a bill, processing payments, and following up on unpaid balances. A medical billing solution employs computer systems that replace human labor with automated processes that allow for human oversight and modification.
In the medical industry, it facilitates a streamlined, expedited, and more effective workflow while also providing accurate information. By streamlining the entire billing and claims process, this all-in-one solution saves time and reduces errors caused by human data entry. Health claims that are more likely to be denied can be uncovered with the help of this predictive analytics tool.
- mHealth Patient Monitoring
mHealth apps collect patient data and provide it in simple ways to read and understand, which can assist doctors in increasing patient participation. Heart rate and blood pressure are just two physiological indicators routinely checked by the remote patient monitoring system. The system notifies the doctor via email and text message if any discrepancies exist.
Also Read: Data Visualization: Not Data, Decisions Should Drive Business Goals
To detect and treat patients as soon as feasible, the remote patient monitoring system can be integrated with wearable equipment, such as glasses with built-in cameras, hearing aids, and cardiac electronic devices.
The system can be set up to notify doctors of upcoming meetings with patients, other medical professionals, and pathologists, as well as virtual interactions with patients. Participants can join the meetings whenever and wherever they have access to the internet.
- Telehealth
As a means to improve healthcare management and reduce administrative costs, healthcare providers are seeking out more sophisticated telehealth solutions. Personalized healthcare payment systems may conveniently manage client payments, and rejection monitoring tools assist with managing accounts receivable.
Bottom Line
The shift in business culture toward an increased emphasis on data has increased the need for visual analysis tools. Data visualization is expected to play an increasingly important role in the healthcare industry. It will provide a holistic view of market activities, from patient profiles to hospital operation monitoring, allowing for better-tailored services for customers and patients alike.
Similar Posts
Telehealth Development- Transforming the future of healthcare
Telehealth is transforming how we get healthcare, and it is at the forefront of that shift. Telehealth, also known as telemedicine or e-health, is revolutionizing the healthcare industry by using technology to connect patients with medical professionals virtually. With the increasing demand for healthcare services and the limited resources available, telehealth has become an important […]...

How Can Small Business Cope With The Long-Term Effects Of Covid-19?
The Covid-19 crisis has been disruptive for many businesses, but the SMBs have had the major burn of all. There has been some relief in 2021 as the vaccines are here, and the lockdown has been removed. But things are still far from ordinary. And according to experts, it can be until august 2021 to […]...
Information Technology Software Solutions for Healthcare Industry
While healthcare is at times misunderstood to be a direct link between illnesses and their standalone treatments, that’s not the case. Ideally, any system of medicine should be constructed as an unbiased, comprehensive unit responsible for curing diseases or improving the quality of a patient’s remaining life, alleviating pain, making care accessible, reducing wastage of […]...


