Hire Data
Visualization Experts

Transform complex data into actionable insights through custom-tailored dashboards, interactive reports, and advanced data visualizations.

14+

Years Matured
Company

02

Development
Centers

95%

Client
Retention

4.7

Google
Rating

Discuss a Project

Custom Dashboards & Visuals

Create personalized dashboards for maximum clarity and interactivity. Custom visual tools enable users to dynamically explore their data, allowing for better-informed decisions with real-time updates and deep user experiences.

Data Integration & Transformation

Cleanse messy, disparate sources of data into a clean, unified format. Our developers prepare your data for accurate visualization so you have just the information you need to inform business insights.

Geospatial Data Visuals

Interactive maps, location-based charts, and spatial analytics visualize geographic data and allow geospatial insights to inform patterns, trends, and opportunities for decision support for location-aware business decisions.

Predictive Analytics & ML Insights

Apply and combine data visualization techniques, such as machine learning, predictive analytics, and models, to help in forecasting trends and outcomes. From raw data to predictive insights that lead to proactionary strategies and better business decisions.

Real-Time & Big Data Visualizations

Big data sets and real-time streaming data so that businesses can track and act on events in real time. Our developers ensure your dashboards handle really large numbers of data smoothly.

Training & Self-Service BI

Empower your team with expert training and consultation on data visualization tools and techniques. Implement self-service BI solutions to enable non-technical users to create their visualizations and reports effortlessly.

Case Studies

How we have helped industry leaders to accelerate business
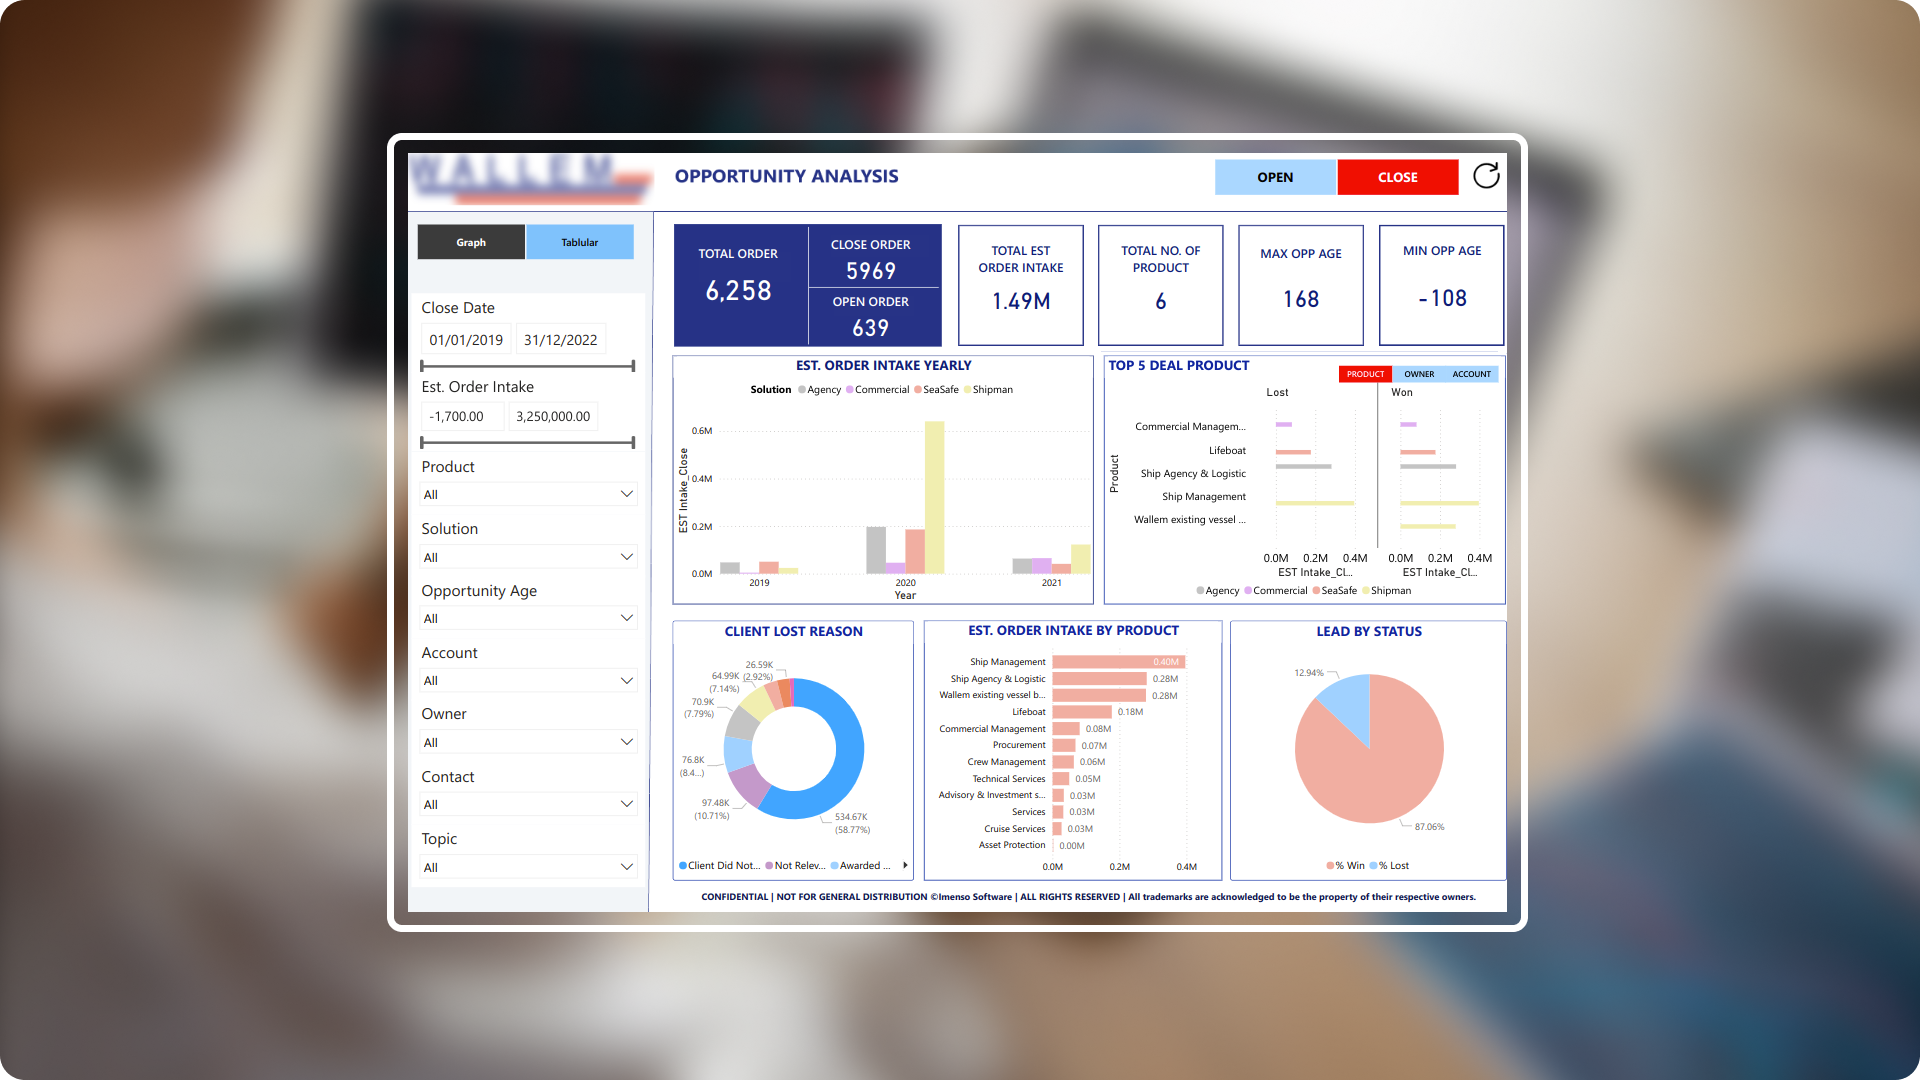
A comprehensive Power BI dashboard for shipping industry insights

A comprehensive Power BI dashboard for shipping industry insights

  • Row-Level Security (RLS)
  • Conditional formatting
  • Synchronizing slicers
  • Scheduled data refreshes
View Case Study
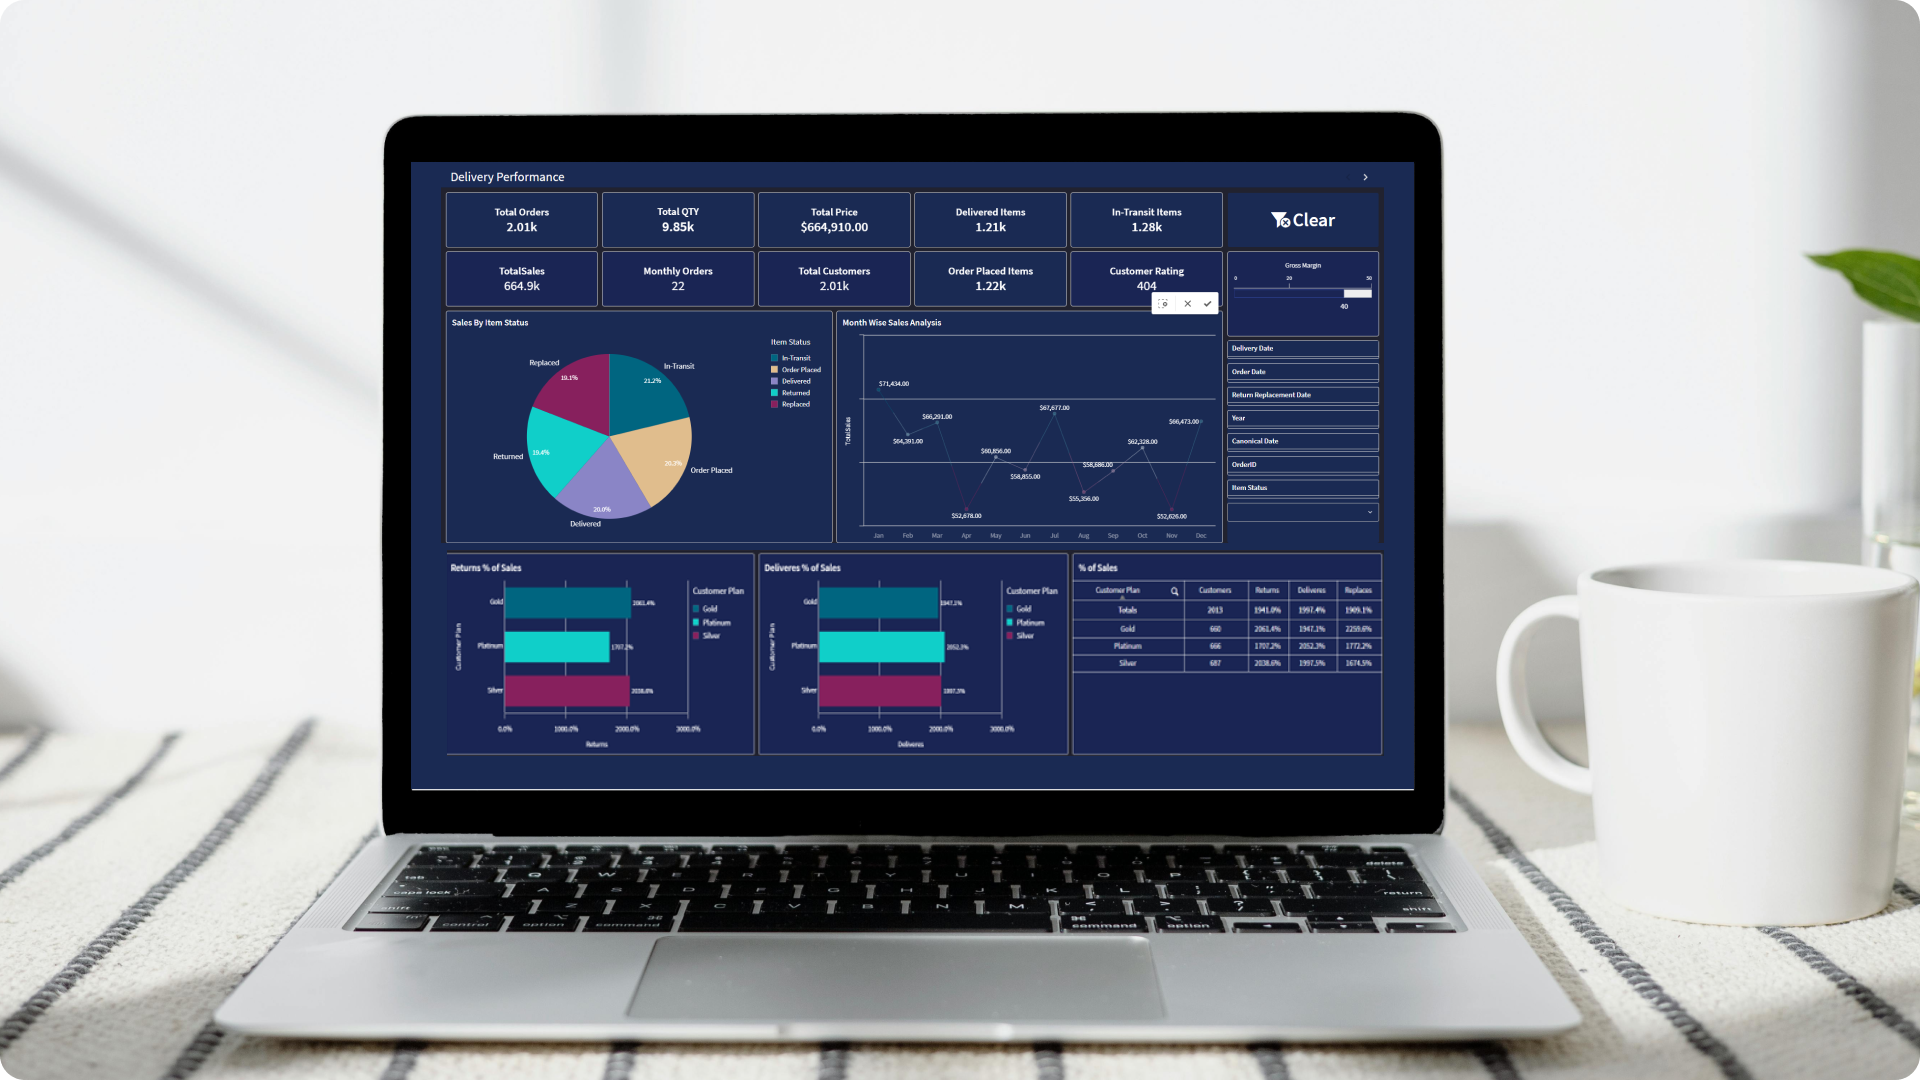
Innovative dashboard solutions for smarter operations

Innovative dashboard solutions for smarter operations

  • Clean and reliable data
  • Targeted customer insights
  • Improved order tracking
  • Clear product insights
View Case Study
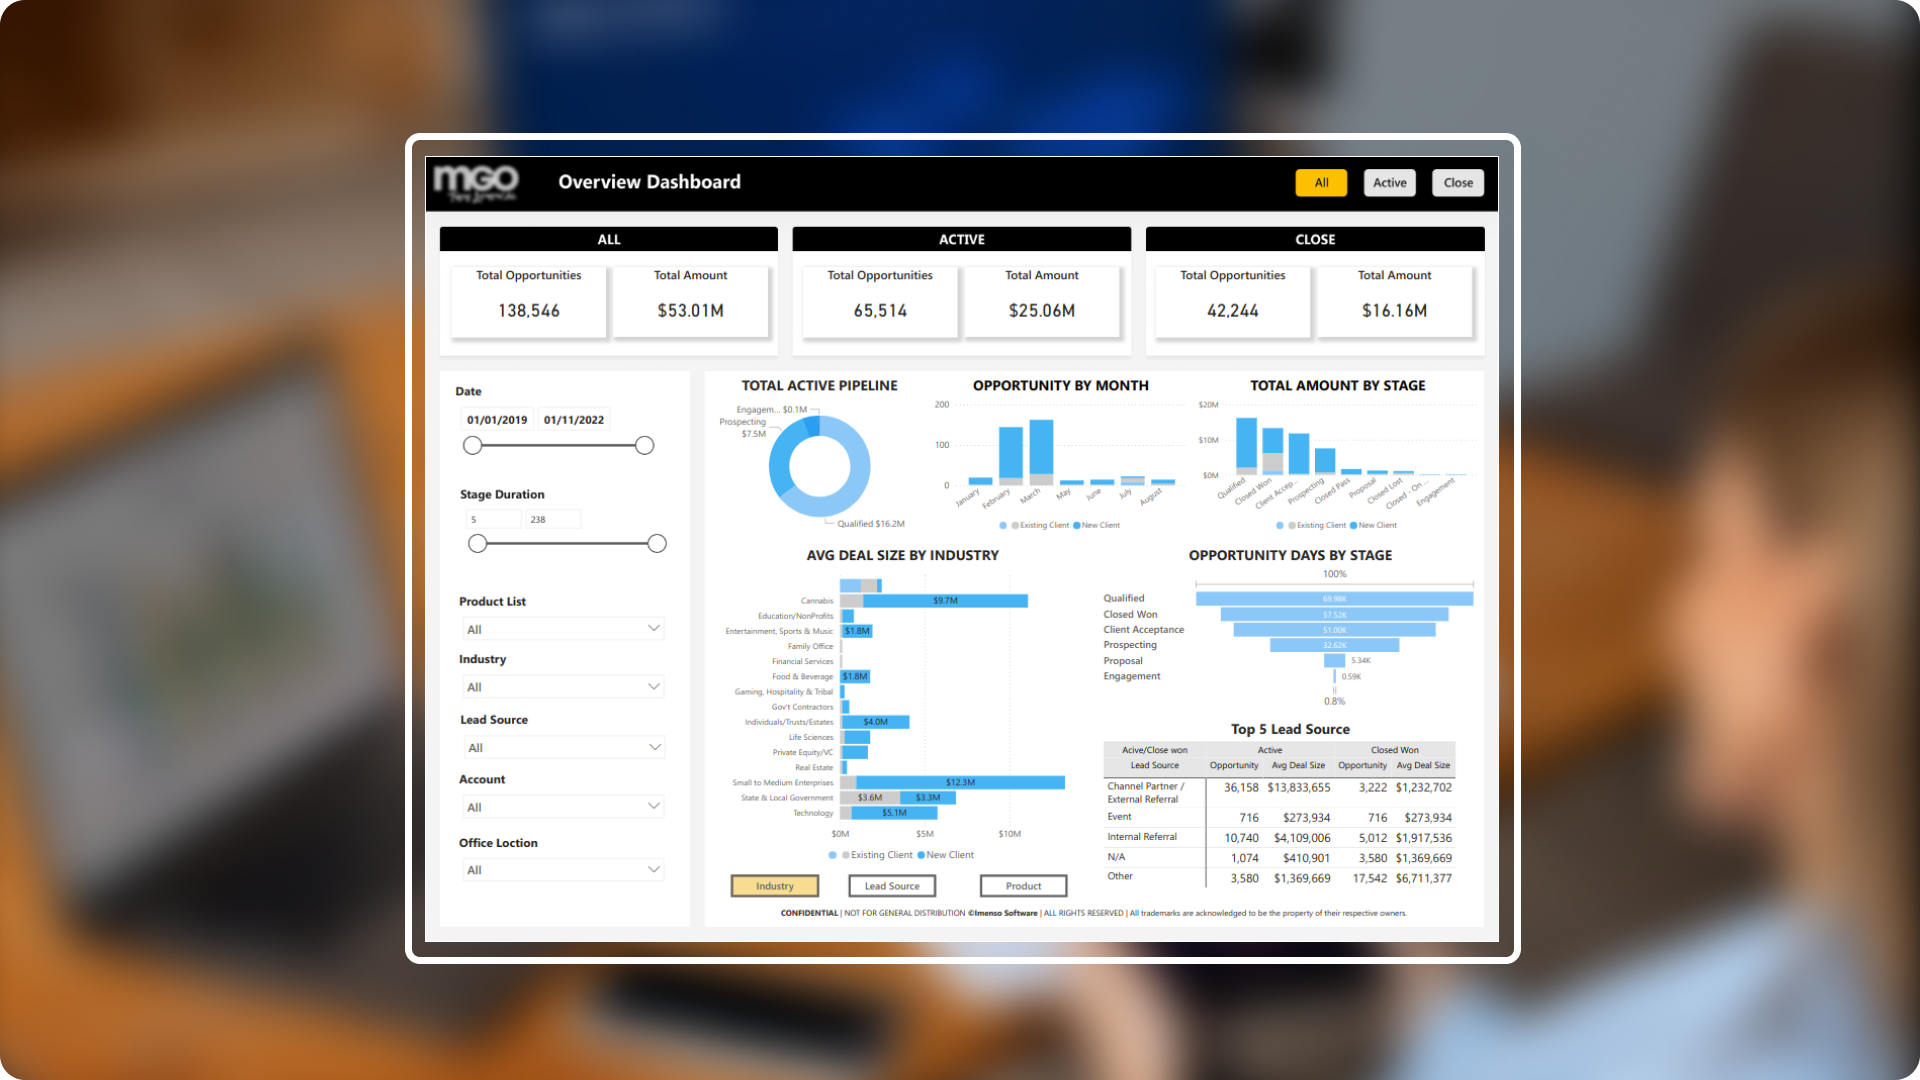
Dynamic dashboard to analyze productivity and growth

Dynamic dashboard to analyze productivity and growth

  • Page and visual level filters
  • Custom visuals and buttons
  • Gauge chart
  • Enhanced UI/UX formatting
View Case Study
Elevating Performance Strategies with Advanced Data Visualizations

Elevating Performance Strategies with Advanced Data Visualizations

  • Data modelling
  • Forecast seasonal demand
  • Digital marketing
  • Identify market trends
View Case Study
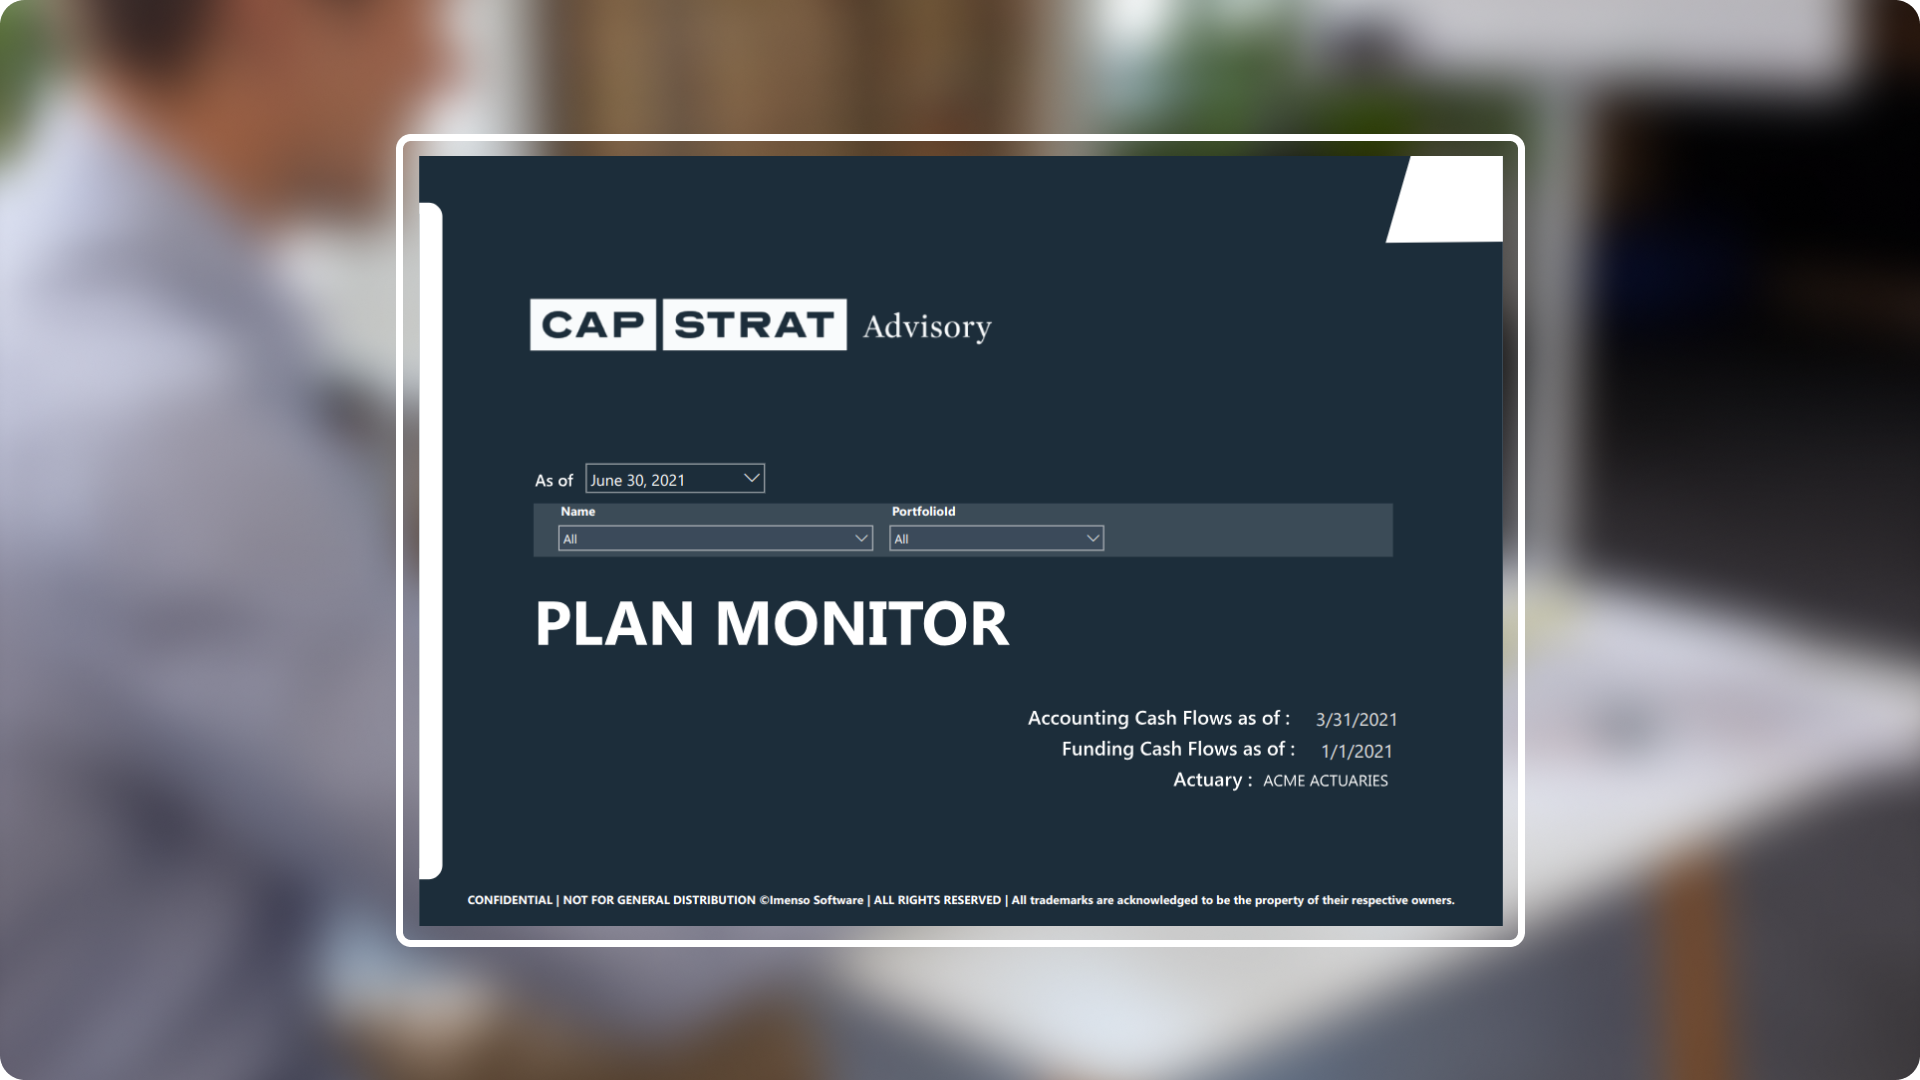
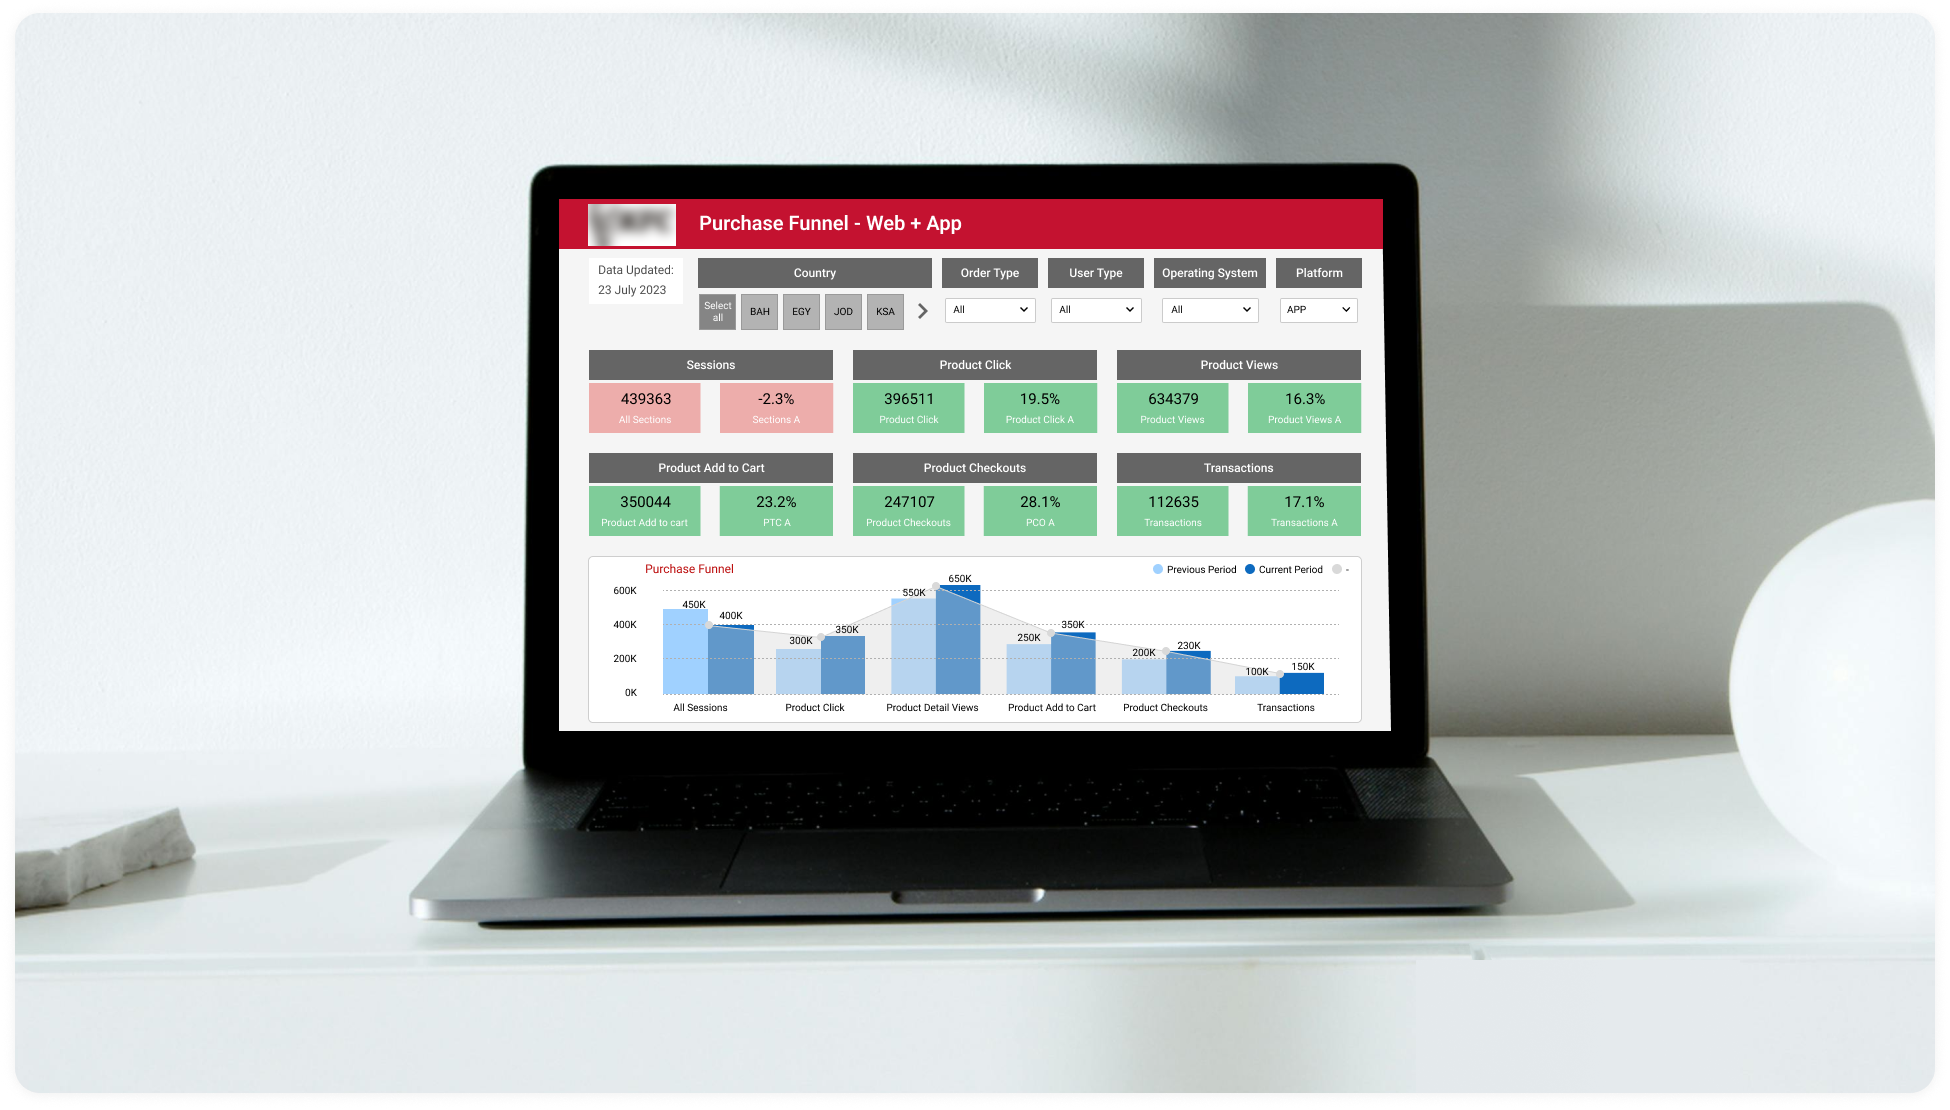
Streamlining global financial services with an advanced Power BI dashboard

Streamlining global financial services with an advanced Power BI dashboard

  • Funnel chart
  • Real-Time data refresh
  • Trend analysis
  • Navigation buttons
View Case Study
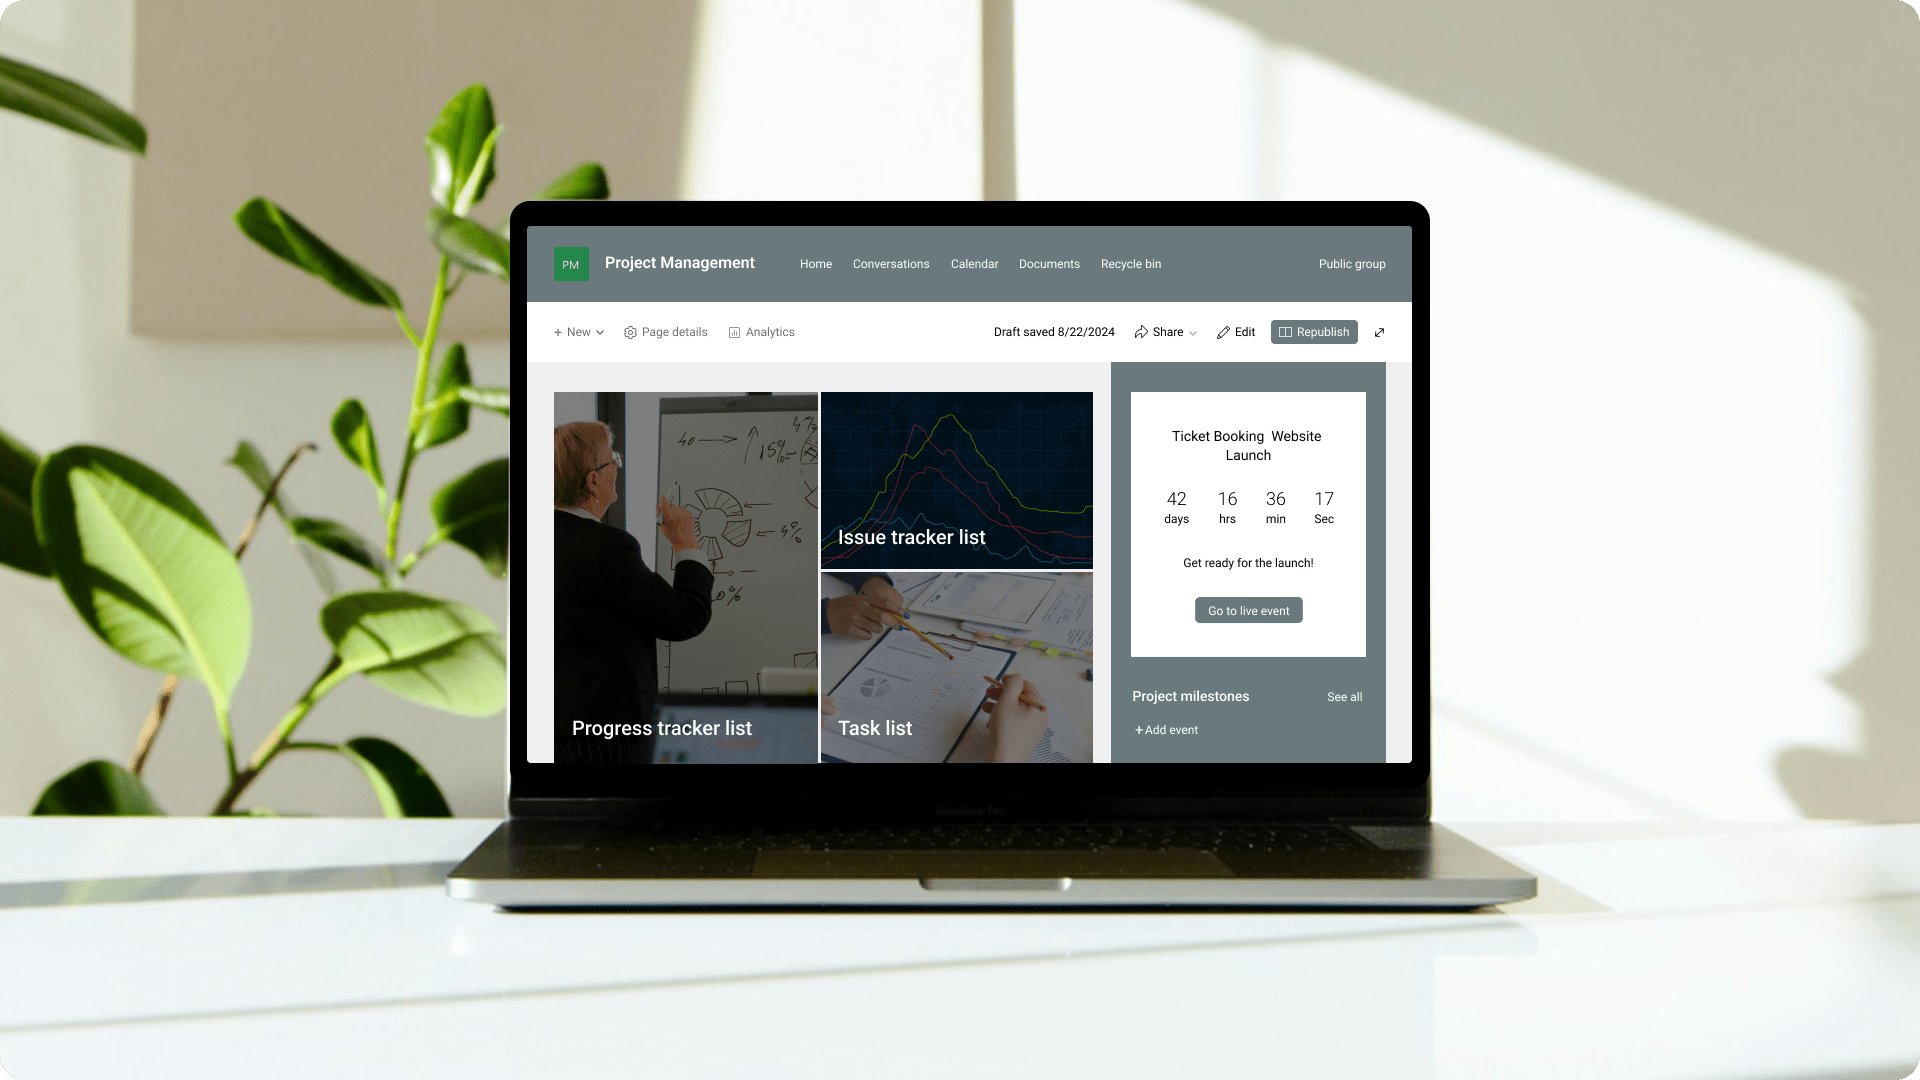
Centralizing resources for efficient project execution

Centralizing resources for efficient project execution

  • Centralized project dashboard
  • Custom task management lists
  • Document management and collaboration
  • Automated workflows

View Case Study
View All Projects
Imenso VS. In-House

Choose the experts in visualization

Outsource to Imenso for the development of data visualization and partner with experts and innovative solutions. Our team guarantees the delivery of tailored visualizations to make a positive impact on data-driven decision-making for your business.

Imenso In-house
Cost imageLower costs with flexible pricing imageHigh salaries and benefits
Expertise imageAccess to a diverse team of specialists imageLimited to current staff skills
Time to Deploy imageQuick access to ready professionals imageLong onboarding process
Flexibility imageEasily adjustable team size based on needs imageHard to scale resources
Focus on Core Business imageFocus on strategy while we handle development imageDistracts from core tasks
Ongoing Support imageComprehensive post-deployment support included imageLimited support after deployment
Latest Technology imageUtilizes cutting-edge tools and methodologies imageMay lack access to new tools
Benefits

See the bigger picture: The impact of data visualization benefits

Data visualization translates tough data into clear insights that add value to the understanding, and it better makes the decision. It supports collaboration, and real-time analytics, and allows stakeholders to make informed, data-based decisions.

Multi-Source Data Integration

Multi-Source Data Integration

Combines data from different sources—be it databases, spreadsheets, or cloud services—into cohesive visualizations. This gives a holistic view of data analysis, whereby users can derive more meaningful insights about it.

Customizable Dashboards & Reports

Customizable Dashboards & Reports

The dashboards and reports can be tailored to include only the most relevant KPIs and metrics needed as defined by the business. This makes it more usable and reduces the chances of focusing on non-relevant data by stakeholders.

Automation of Data Updates

Automation of Data Updates

Data visualizations are refreshed automatically, with real-time updates. Thus, it does not require in-flow or adjustments manually. It ensures that the latest insights always reach the decision-makers which increases responsiveness.

Scalable Cloud-Based Solutions

Scalable Cloud-Based Solutions

Through cloud technology, data visualization solutions can easily scale up with increases in data volume and complexity. Small businesses can leverage such growths without impacting performance without having a large IT infrastructural setup.

AR & VR Data Visualization

AR & VR Data Visualization

AR and VR are technologies that have augmented and virtual reality that enable users to interact with visualization through real experiences involving visual interaction. It makes complex data more accessible and impactful.

Historical Data Comparison

Historical Data Comparison

User comparison of historical data can be made possible with the help of data visualizations, bringing out trends as well as changes over time. This serves to help in decision-making through telling back stories around past performance.

Our Engagement Models

Flexible engagement models to suit every business need

Dedicated Resources

Hire dedicated developers for your offshore projects with Imenso Software. Our full-time experts deliver regular progress updates and ensure timely completion using agile methodology.

Hire a dedicated resource
Recommended For
  • Full Control
  • Top Quality
  • Regular Updates
  • Agile Development
  • Quick Completion
  • Skill Specialization
  • Time Zone Alignment
  • Resource Scalability
  • Long-term Engagement

Fixed Time and Price

Choose our fixed time and price model for projects with a clear scope and budget. This model offers flexibility and cost predictability.

Estimate your project
Recommended For
  • Small Projects
  • Fast MVP Development
  • Budget Certainty
  • Low Risk
  • Timely Delivery
  • Predictable Budgeting
  • Defined Milestones
  • Project Flexibility
  • Risk Mitigation
icon

Quick Fact

Our clients don't just stay; they evolve. What begins as a fixed-price project often blossoms into a dedicated, long-term partnership lasting an average of 5+ years. It's a testament to our commitment and the trust we build.

Process

The expedition for hiring ultimate talent

Our hiring process for data visualization developers at Imenso is pretty straightforward. We adhere to the detailed 6-step process of requirement analysis, expert matching, interviews, onboarding, development, and sustained support to ensure success.

Consultation

We begin by listening to you on your project’s requirements, goals, and challenges to get a thorough understanding of your data visualization requirements. Based on that, we develop a customized solution for you to meet your business objectives.

Requirement Analysis

Proper analysis of your data and project needs is carried out so that all the technical as well as functional aspects are covered. This will make clear the scope of the project, with a proper base for which the development is made to occur.

Proposal

Receive a custom proposal with its resources, timelines, and costs. This detailed plan helps you make well-informed decisions to see the transparency as you walk along the road to building your data visualization solution.

Onboarding

We will onboard the best-fit developers based on your needs and quickly integrate them into your team to ensure an efficient start-up during development when highly skilled specialists are ready to deliver.

Development

Our competent developers begin working on a data visualization solution for you and do their job with the latest tools and methodologies. You will get regular updates and clear communication that help the plan go accordingly.

Deployment & Support

Once our solution is deployed, it is continuously supported and optimized to ensure that the visualizations perform well and leverage changing business needs to ensure that data insights remain actionable and up-to-date.

Words of Appreciation

Voices of trust and confidence

The finished platform is excellent, was delivered on time, and matches the quality standards. The team worked efficiently through an agile methodology and is skilled at what they do.
Andres Mark
The web application exceeded my expectations. It was a lengthy project, but the team at Imenso stayed on top of development, fixing any issues no matter what time of day. It was an effective partnership.
Apurva Harne
Imenso Software performed a difficult WordPress enhancement for me. It required a new fresh design with changes to my shopping cart, paid member services, and membership management. I highly recommend Imenso Software for web related work.
Tom Updegrove
We were looking to double our business, and the Imenso Software solutions helped us with that. Their team effort improved the website’s efficiency and improved the margins. They are always quick to reply and very proactive in everything they do.
Niko Zeus
It’s been a positive experience working with Imenso Software on B2B and B2C applications. Their IT team is talented and hardworking. We value our partnership and will continue to collaborate in the future.
Alice Nova
The team at Imenso delivers satisfactory work for our clients. Working for the client’s framework. They have a good communication system and manage everything well. They consistently show commitment to their work.
Amelia Lyra
The Imenso team is highly expert at Power BI but it’s the proactive, energetic approach they take to our challenges that I value the most. They’re a true partner – an extension of our team in every way. I recommend them without hesitation.
John Joseph
We had a need to develop web application for one of our product so we were looking for a partner who could implement the same for us. That’s when we found Imenso. Their team is well experienced in all aspects starting from design to implementation.
Vinoth Kumar Rajapandian
INDUSTRIES WE SERVE

Precision solutions, custom-crafted for every industry

Discover how Imenso Software is revolutionizing industries worldwide. From healthcare to finance, we cater to diverse sectors with precision and expertise.

Healthcare

Healthcare

Healthcare

  • Electronic Health Records Solutions
  • Telemedicine Platforms
  • Clinical Decision Support Solutions
  • Fitness and Wellness Tracking Area
  • Medical Imaging Software
  • Artificial Intelligence (AI) Diagnostic Tools
Know More

Legal

Legal

Legal

  • Client Relationship Management Solutions
  • Law Firm Management Systems
  • E-Discovery Tools
  • Document and Contract Tracking Systems
  • Legal Time Management and Invoicing Software
Know More

Human Resources

Human Resources

Human Resources

  • Applicant Tracking System
  • Employee Onboarding Software
  • Payroll Processing System
  • Workforce Scheduling Software
  • Performance Management Software
Know More

Food and Restaurant

Food and Restaurant

Food and Restaurant

  • Customer Relationship Management (CRM) Software
  • Restaurant Management Software
  • Kitchen Display Systems
  • Accounting and Payroll Software
  • Quick Recipebook Chatbot

Events

Events

Events

  • Event Mobile Apps
  • Virtual Event Platforms
  • Registration and Ticketing Software
  • Event Management Software
  • Event Sponsorship and Revenue Management Software
  • Event Marketing Software
Know More

FinTech

FinTech

FinTech

  • Blockchain Platforms
  • Digital Wallets
  • Robo-Advisors
  • InsurTech Software
  • Financial Planning Software
Know More

Manufacturing

Manufacturing

Manufacturing

  • Manufacturing Execution System
  • Product Lifecycle Management Solutions
  • Supply Chain Management Software
  • Quality Management System Software
  • Human Resources Management System
Know More

Insurance

Insurance

Insurance

  • Claims Management Software
  • Underwriting Software
  • Risk Management Software
  • Insurance Analytics Software
  • Mobile Insurance Apps
Know More

Logistics

Logistics

Logistics

  • Supply Chain Management Software
  • Freight Management Software
  • Inventory Management Software
  • Tracking and Tracing Software
  • Transportation Management Systems
Know More

Real Estate

Real Estate

Real Estate

  • Virtual Tour and 3D Property Showcase Development
  • Mobile App Development for Real Estate
  • Real Estate Market Analysis Tools
  • Real Estate CRM Development
  • Property Management Software Development
Know More

Media and Entertainment

Media and Entertainment

Media and Entertainment

  • Video Streaming Platforms
  • Cloud-Based Collaboration Tools
  • Augmented Reality (AR) and Virtual Reality (VR) Development Tools
  • Social Media Management Software
  • 3D Animation & Modeling Software
Know More

eCommerce

eCommerce

eCommerce

  • Payment Gateway Integration
  • SEO and Digital Marketing Services
  • Security and Fraud Prevention Solutions
  • Mobile App Development for E-commerce
  • Social Media Integration and Automation
Know More

EdTech

EdTech

EdTech

  • Learning Management System
  • Online Course Platforms
  • Virtual Classrooms & Collaboration Tools
  • Assessment & Testing Software
  • AI-Powered Tutoring Systems
Know More

Travel

Travel

Travel

  • Tour Operator Software
  • Hotel Management Software
  • Travel CRM (Customer Relationship Management) Software
  • Mobile Travel Apps
  • Travel Expense Management Software
Know More

Automotive

Automotive

Automotive

  • Automotive Manufacturing Software
  • Vehicle Simulation Software
  • Automotive Diagnostic Software
  • Automotive Design and CAD Software
  • Autonomous Driving Software
Know More
image

Have a project in mind?

Get your project on track with precision planning! Imenso Software's experts can calculate your budget and timeframes.

Get an estimate
What sets us apart

Why Imenso's data visualization team is your best choice

Hire professional Data Visualization developers from Imenso Software for customized solutions, real-time insights, secure and scalable systems, and ongoing support. Empower your business with data-driven tools for smarter decisions.

Cross-Tool Compatibility

We will ensure that the visuals developed work seamlessly across multiple tools, such as BI Power BI, Tableau, or any custom-built platform, thereby providing versatility and efficiency for meeting the needs without migrations between tools.

Real-Time Data Integration

Our developers excel in the integration of real-time data sources, which helps make possible up-to-the-minute insights. This will ensure businesses can therefore make timely decisions with the most current information ahead of any change in the market.

Interactive & Dynamic Visuals

Imenso specializes in interactive dashboards that drill down, filter, and explore data dynamically. All these visualizations allow for far more engaging experiences and will let you dig deep to a level that suits you.

Predictive Modeling Integration

We integrate machine learning models into your data visualizations that facilitate predictive analytics. Businesses can then study the pattern of developing trends, proactively and with great accuracy, based on their decisions.

Post-Deployment Support

Our company delivers support after the software's deployment to monitor, troubleshoot, and optimize performance. We ensure your system stays efficient and aligned with the ever-changing needs of a business.

Big Data Handling

Our team excels at visualizing large data, ensuring the smooth processing and effective insights of the huge data. You will be able to harness important information using big data and attain performance without compromising accuracy.

Blogs

Insights & Inspiration

Dive into a world of tech trends, development tips, and industry insights. Our blog is your go-to resource for staying informed and inspired.

The Power of Visual Analytics: How Power BI Enhances Healthcare Insights
December 6, 2024 | 9 min read
The Power of Visual Analytics: How Power BI Enhances Healthcare Insights

Ever wish you could see how your hospital is performing at a glance? That is exactly what Power BI in healthcare does! Just imagine it as your hospital's smart dashboard. Everything from care for patients to reso...

Read more
FAQs

Quick FAQs: answers you seek!

What is the role of a data visualization developer?

A data visualization developer turns complex data into easy-to-understand visuals. They use various tools and techniques. They amplify insights, improve findings, and help stakeholders make informed decisions.

What is data visualization development?

Developing data visualization entails designing and building friendly interfaces for presenting data in understandable formats. The whole process has required gathering data, processing data, and utilizing visualization tools for the development of interactive reports, dashboards, and charts to help make decisions.

What skills are used in data visualization?

The data visualization skills include: using tools like Tableau and Power BI, programming in Python and R, and data analysis. They also include storytelling, design principles, user experience, and business intelligence.

What are the 5 steps in data visualization?

Data visualization has five steps: 1. Define objectives. 2. Collect and prepare data. 3. Choose visualization types. 4. Design and create visuals. 5. Evaluate results. Since the above process is orderly, visualizations are used effectively to achieve user requirements.

What is the main purpose of data visualization?

Data visualization essentially helps in the translation of complex data into information easily actionable and understandable. It can enhance insight, help identify a pattern, and inform the decision-making process to bring about better business outcomes.

How to make data visualization?

Data visualization development is the process of creating user-friendly interfaces. These interfaces present data in easy-to-understand formats. The whole procedure requires three steps. First, gather data. Second, process it. Finally, use visualization tools to create interactive reports, dashboards, and charts. These will aid decision-making.

Where is data visualization used?

Data visualization is used in finance, healthcare, marketing, and education as part of different industries. It assists one in viewing trends, tracking performance, and sharing insights toward further optimization of operational efficiency and driving data-driven decisions.

Why choose Imenso Software for Data Visualization developers?

Imenso Software offers seasoned data visualization developers with technical acumen seasoned by industry experience. The customized solutions delivered ensure accurate insight in a visual form tailored to your business needs to enhance the decision-making process and value insights.

How much does it cost to hire a Data Visualization developer?

Sourcing a data visualization developer would largely depend on the experience and complexity of the projects required. The cost could vary drastically with the specific requirements, duration of the project, and the output to be achieved.

What is the typical timeline for a Data Visualization project?

A data visualization project’s time frame would always be variable. It would depend on the project’s complexity and scope. Projects usually take a few weeks to several months. They start with planning, preparing the data, and designing a visualization. Then, we finalize the deployment to get good results.

Say hello to your
next tech partner

What will be the next steps?

You are one step closer to build your dream product.

  • 01
    One of our experts will get in touch with you.
  • 02
    Schedule a meeting to discuss your requirement in more detail.
  • 03
    Proposal with time and cost estimate.
Please complete this required field
Get an Estimate
Learn more about software outsourcing
#imenso

Think Big

Rated 4.7 out of 5 based on 32 Google reviews.