Top Tools and Resources for Power BI Experts: Elevate Your Data Skills

A company’s success has become reliable in the ability to extract insightful conclusions from big data units. At the frontline of this analytical revolution is Microsoft’s Power BI. Power BI developed by Microsoft is an outstanding business intelligence product. It’s no ordinary instrument. It is a technology that assists companies in turning unstructured data into insightful knowledge.
Do you want to become a highly compensated data and business analyst by becoming a Power BI expert in data visualization? Then it is essential to learn it.
To assist you on your path, we will thoroughly examine and go over the top tools and resources for Power BI experts in this extensive guide.
The Top Tools and Resources for Power BI Experts
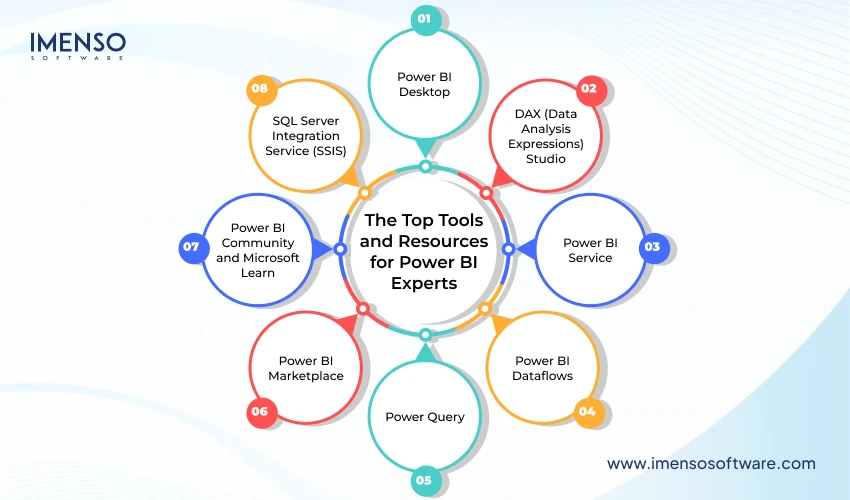
Power BI is a robust tool for data analysis and business intelligence, however, to completely open up its potential, experts frequently rely on a range of additional tools, integrations, and learning resources. These can help professionals enhance their reporting capabilities. They can also help streamline workflows. In addition, they can enable professionals to dive deeper into data insights. Below are some of the top tools and resources for Power BI experts that can elevate your data analysis game:
1. Power BI Desktop
Power BI Desktop is the core tool used by most Power BI experts. It’s a free platform for building advanced data models. It offers comprehensive features for creating dynamic reports. It transforms data from more than one source into actionable insights. Power BI Desktop enables customers to create custom dashboards with the use of drag-and-drop features. This makes it a really perfect device for both novices and seasoned professionals.
Key Features:
- Data modeling and transformation capabilities
- Visualizations for interactive dashboards
- Ability to combine multiple data sources into one cohesive report
- DAX (Data Analysis Expressions) for advanced analytics
2. DAX (Data Analysis Expressions) Studio
DAX is the component language used in Power BI for data modeling and calculations. For Power BI reporting specialists seeking to push the bounds of data analysis, DAX Studio is a significant tool. It enables advanced querying of DAX formulas. This provides opportunities for optimization and debugging. Resulting in deeper insights into your data models.
Why Use DAX Studio:
- Optimize DAX queries to improve report performance
- Debug and troubleshoot complex DAX formulas
- Analyze data models and calculations at a granular level
3. Power BI Service
The Power BI Service is the cloud-based aspect of Power BI, permitting you to submit and share reviews throughout your business. For experts, this platform offers advanced collaboration features. Everyone, from the C-suite to frontline personnel, is accessible to real-time data insights.
Key Benefits:
- Real-time data refresh for up-to-date reporting
- Secure sharing and collaboration on dashboards and reports
- Mobile-friendly, allowing you to access reports on the go
4. Power BI Dataflows
Dataflows are an invaluable resource for Power BI experts. They help manage large datasets across multiple platforms. Dataflows allow users to create a standardized data source for Power BI projects. This data source can be used by various reports and dashboards, ensuring consistency across all Power BI projects. This feature is especially useful for organizations dealing with complex data architectures.
Top Advantages:
- Centralize and reuse data transformations
- Simplify ETL (Extract, Transform, Load) processes
- Maintain data consistency across multiple reports
5. Power Query
Power Query is an integral device for Power BI reporting specialists, providing effective data transformation and connection functions. It helps customers smooth, rework, and load statistics into Power BI from several assets, permitting the introduction of incredibly customizable and smooth datasets for reporting.
Why Experts Love Power Query:
- Automate data cleaning and transformation tasks
- Merge, append, and manipulate large datasets easily
Support for numerous data sources, including databases, web services, and cloud platforms.
Also Read:
Power BI Data Modeling Best Practices
A Practical Guide to Data Visualization with Power BI
Power BI in Action: Real Business Benefits You Can’t Ignore
6. Power BI Marketplace
The Power BI Marketplace affords a wide array of custom visuals, connectors, and third-party integrations, permitting Power BI experts to enhance the capability of their reports. It’s a fantastic useful resource for locating new approaches to visualize data and attach with specialised data sources.
Top Features:
- Access to hundreds of custom visuals, from heatmaps to funnel charts
- Integration with third-party tools such as R, Python, and Salesforce
- Connectors to external platforms for seamless data integration
7. Power BI Community and Microsoft Learn
For those looking to improve their expertise and stay updated with state-of-the-art developments, the Power BI Community and Microsoft Learn are wonderful sources. Here, you’ll find forums, tutorials, and fine practices shared through the global community of Power BI users and specialists.
Why It’s Important:
- Access free training and certifications
- Learn from fellow Power BI professionals through case studies and discussions
- Stay current with new Power BI features and updates
8. SQL Server Integration Service (SSIS)
For Power BI experts employed with big datasets, SQL Server Integration Services is a crucial device for statistics integration. SSIS helps in extracting, remodeling, and loading data from diverse resources into Power BI, making it best for managing complicated data workflows.
Why SSIS is Critical:
- Automates the integration of large datasets
- Seamlessly connects with Power BI for smooth data transfer
- Enables more complex ETL processes to support advanced analytics
9. Power BI Embedded
Power BI Embedded permits developers to integrate Power BI reviews and dashboards into custom applications. For companies looking to supply powerful analytics to their customers without leaving their platform, Power BI Embedded is an invaluable aid.
Top Features:
- Embeds Power BI analytics into apps for a seamless user experience
- Provides robust API for custom development
- Offers scalable analytics solutions for large user bases
Conclusion
For those looking to excel in data analysis and reporting, mastering Power BI’s full potential requires the right tools and resources. Whether it’s using advanced data transformation features like Power Query, optimizing performance with DAX Studio, or exploring the wide range of custom visuals in the Power BI Marketplace, there are countless resources available to enhance your expertise. With the top tools and resources for Power BI experts, you can deliver more insightful reports. More efficient reports. Reports with greater impact. Reports that drive real business value.
A Power BI expert can stay current with the latest tools and continue learning. By doing so, they can push the limits of what’s viable with data and flip it into a strategic gain for their business.
We’re honored to mention that our efforts have been recognized by renowned B2B review and research platforms such as GoodFirms, Clutch, MirrorView, and many more.
Want more information about our services?


Similar Posts

10 Industries Revolutionized by Business Intelligence Analytics
Back in the 1960’s companies used to make decisions based on data calculated with a lot of human resource and effort. But since the rise of technology and the ease of collecting and storing data, business intelligence is the new way through companies and enterprises are making decisions to meet their most ambitious goals. ...
Why Data Analytics Solutions Should Be The New Trend SMBs Catch Up On
Here is an interesting fact – today, humans produce 2.5 quintillion bytes of data every day. How much do you think it is? It’s 2.5, followed by 18 zeros! Mind-bending right?...

How Power BI Professional Services Can Transform Your Business Operations
Imagine being in a boardroom when someone asks how your company has performed in the Asia-Pacific region during the last quarter. Rather than tediously searching through endless spreadsheets or ordering a report that will take days to develop, you whip out a beautiful, interactive dashboard from your tablet and present live data with vibrant visualizations […]...


