A new approach to manage hospital readmissions
- Industry: Healthcare
- Country: Dubai
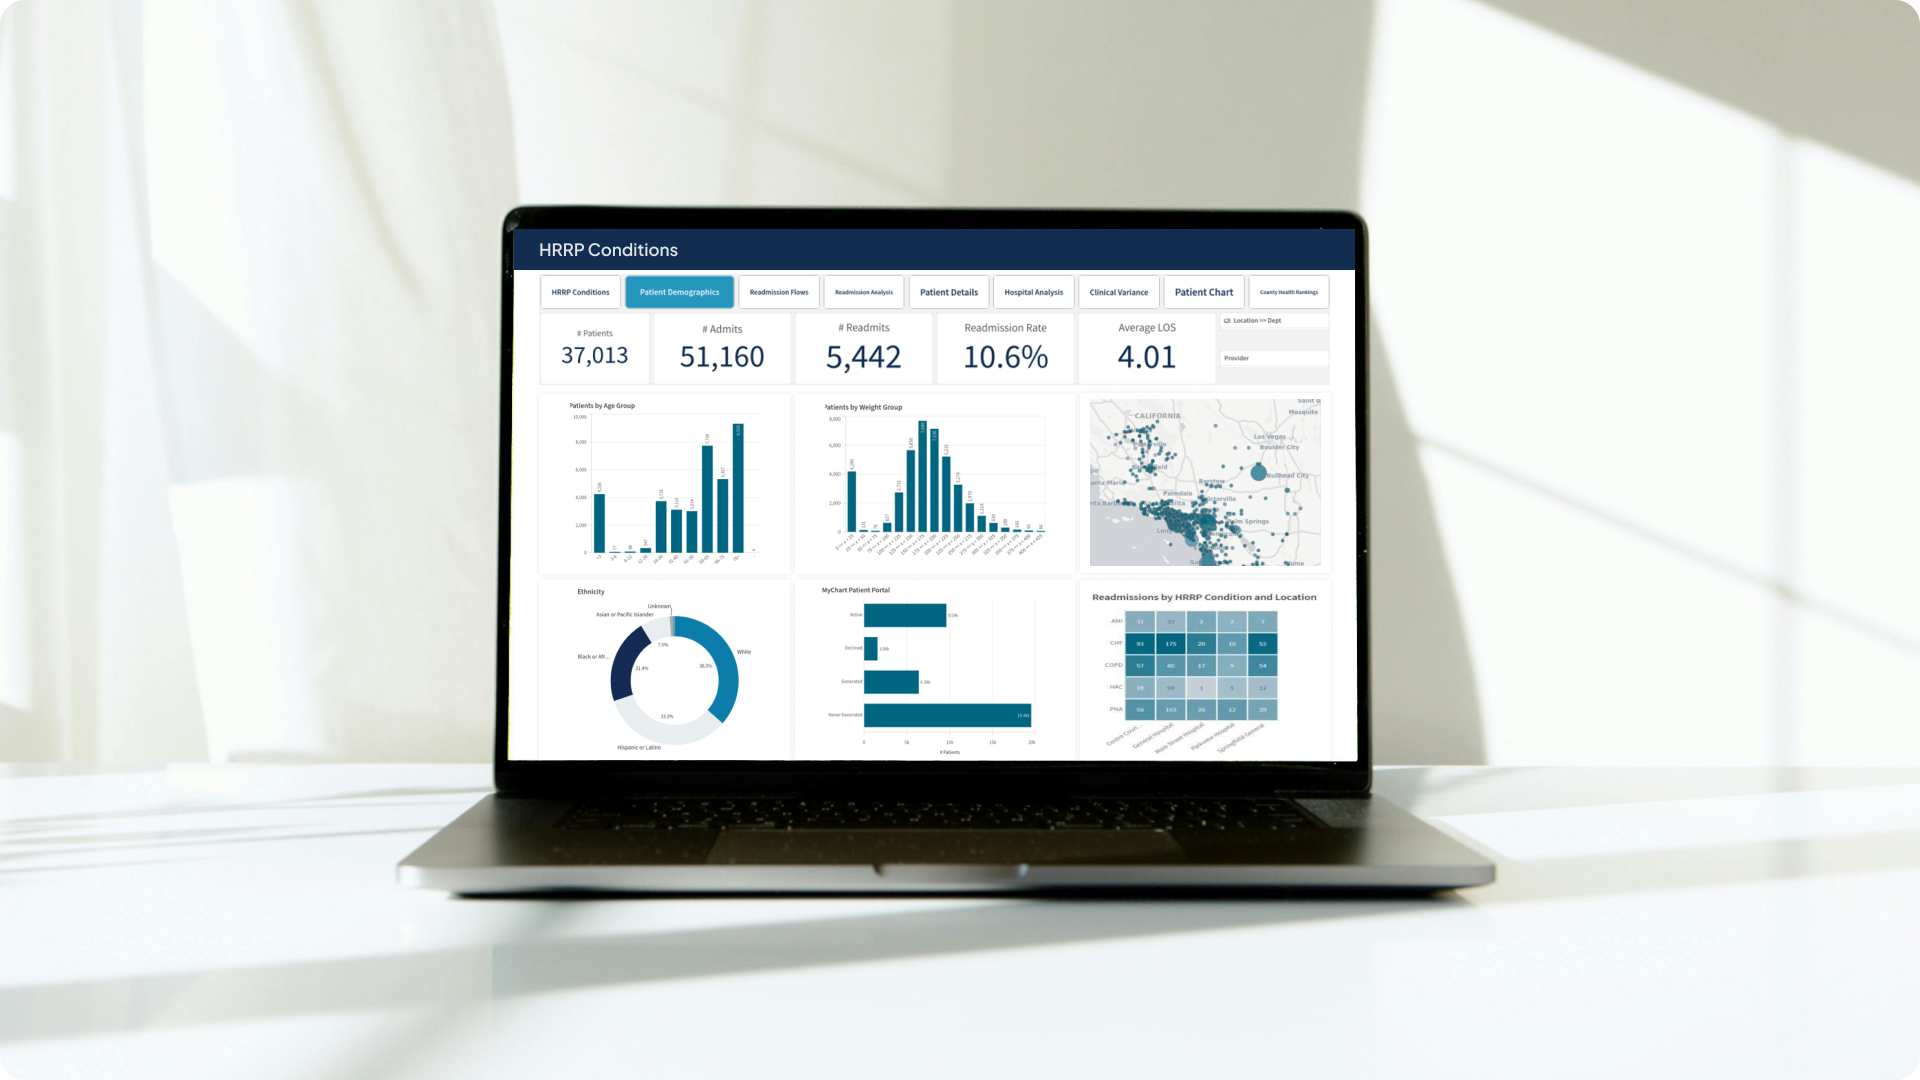
The hospital readmission reduction dashboard to watch how often patients in the Medicare program come back after leaving. If Medicare patients return within 30 days for the same reason they left, the hospital might get less money.
The core challenges
- Custom dashboard creation: Empower healthcare providers to personalize their dashboard layout according to their specific needs and preferences.
- Adaptive chart scaling: Adjusted chart settings to effectively visualize variations in readmission rates, accommodating both small values and significantly larger ones.
- Hierarchical data filtering: Enabled healthcare providers to refine and analyze readmission data using nested filters, allowing for a hierarchical or layered approach to data exploration.
- Data transformation for visualization: Organized raw readmission data into a format optimized for visualization and analysis, tailored to meet the specific requirements of the dashboard charts.
- Dynamic report generation: Enabled healthcare providers to generate dynamic reports based on selected charts, key performance indicators (KPIs), and filtered records.
Solution We have developed an advanced data visualization tool tailored to represent complex healthcare data in an easily understandable format.
-
 Unified data storage: Created a Context API to store data centrally, facilitating efficient data management and access across the application.
 -
 Customizable dashboard layout: Enabled versatile layout customization in Qlik Sense by integrating various charts and KPIs, providing users with dynamic visualization options tailored to their specific data analysis needs.
 -
 Intuitive chart rearrangement: Make it easy for users to move charts around by dragging and dropping them wherever they want on the screen.
 -
 Enhanced user experience: Users interacted with the application in their preferred language for improved usability and access to resources.
 -
 Comprehensive data exploration: Allowed users to explore data in more detail by enabling drill-down capabilities, allowing them to navigate from summarized information to more granular levels for deeper analysis and insights.
 -
 Real-Time data integration: Enabled integration with real-time data sources to provide up-to-date information on patient admissions, discharges, and readmissions. Real- time data integration empowers healthcare providers to monitor trends and respond promptly to changes in patient outcome.
Integration.
Equipped with a variety of
chart types.
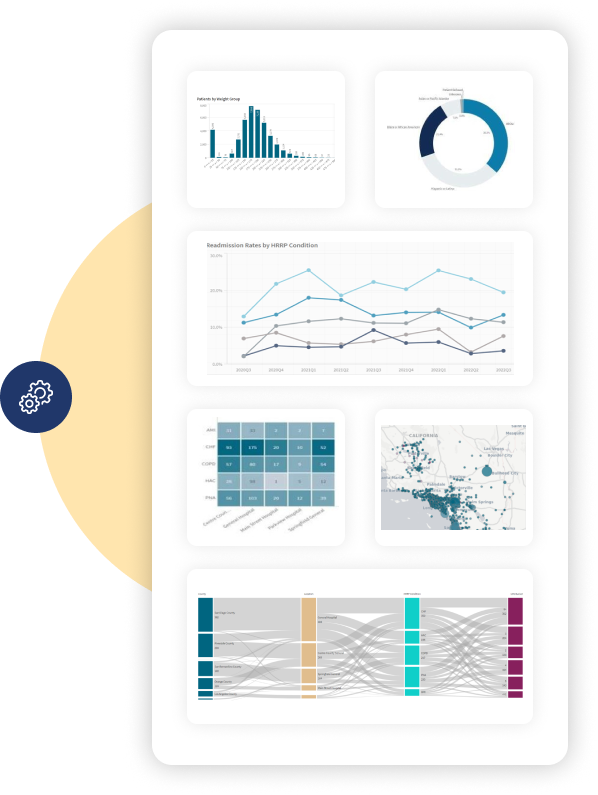
Application is equipped with a diverse array of chart types, providing healthcare providers with comprehensive visual representation options for data analysis. We have seamlessly integrated various types of Fusion Charts and am Charts to offer a wide range of visualization capabilities tailored to the needs of the Hospital Readmissions Reduction Program (HRRP).
FusionCharts.
- Heat Map chart
- Treemap chart
- Sankey chart
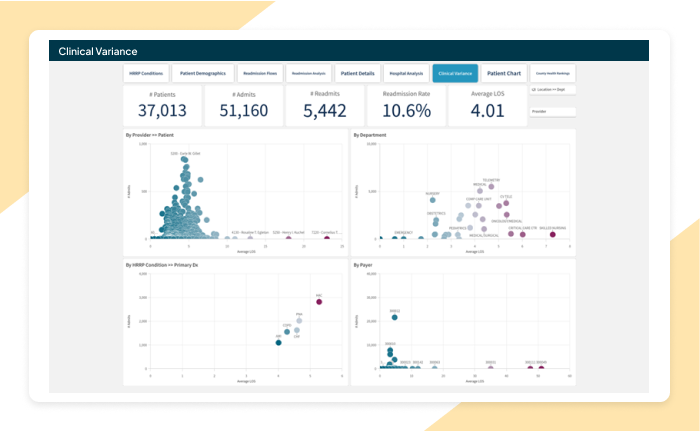
- Bubble chart
- Maps chart
- Pie chart
- Line chart
- Bar chart
amCharts.
- Treemap chart
- Bubble chart
Optimized for fast loading
Customization.
How we play with different controls
Implementation for the Hospital Readmissions Reduction Program (HRRP), we haven't simply integrated charts; we've customized them to enhance data visualization, ensuring a precise representation that perfectly aligns with each chart's unique characteristics.
Color palette algorithm
Implemented an algorithm for dynamically adapting a color palette, which involves the utilization of a set of rules and procedures that automatically adjust the colors used in a chart based on changes in the values of the underlying data.
Min-Max algorithm
Addressed the challenge of substantial differences in magnitudes where the smallest value bar may not be visible in a chart. To mitigate this issue, we have implemented a min-max algorithm to ensure the proper representation of all bars in the chart, regardless of variations in data magnitudes.
Enhancement.
By adding useful features.
Healthcare providers can enhance their data analysis capabilities, gain actionable insights, and improve patient care outcomes by effectively managing hospital readmissions.
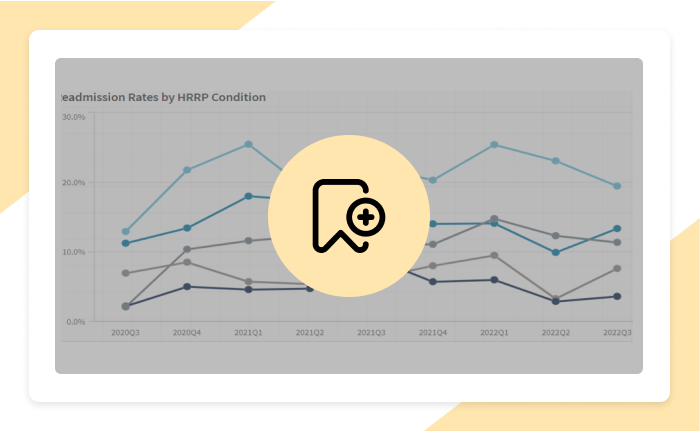
Dynamic bookmarks
Dynamic bookmarking in a hospital readmission analysis enables users to save and revisit specific data selections, filters, and dashboard layouts, facilitating collaboration and efficient decision-making.
Customizable dashboards
Implemented customizable dashboards that allow healthcare providers to personalize their interface by selecting and arranging charts, graphs, and KPIs according to their preferences. This feature provides flexibility in data visualization and ensures quick access to critical information.
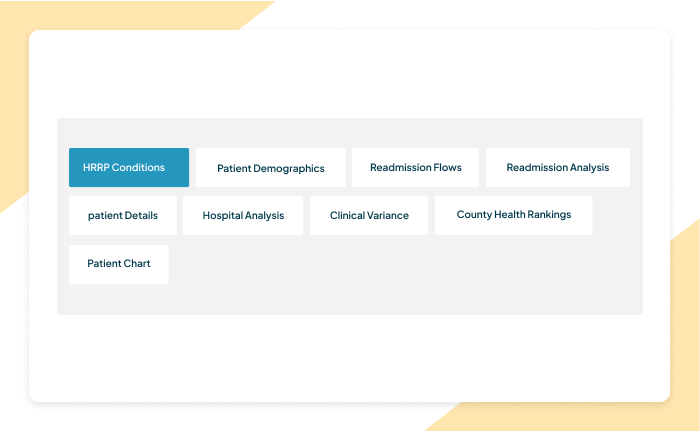
Buttons
In hospital readmission analysis, buttons help users easily move between important sections of data, like patient details and readmission rates, making it simpler to explore and understand the information without relying solely on filters.
Explore more.
Additional features.
Advanced filtering options. Introduced advanced filtering options to enable users to refine data analysis based on specific criteria such as patient demographics, medical conditions, time periods, and hospital locations. This enhances data exploration and facilitates targeted insights into readmission patterns.
Collaboration features. Integrated collaboration features such as commenting, annotation, and sharing functionalities within Qlik Sense. These features promote teamwork and facilitate knowledge sharing among healthcare providers, fostering a collaborative approach to readmission reduction strategies.
Export preferred charts/KPIs. Incorporating the ability to export preferred charts and KPIs from Qlik Sense for the Hospital Readmissions Reduction Program (HRRP) can significantly enhance user experience and facilitate data sharing.


