The Role of Data in Feature Prioritization: Making Better Decisions
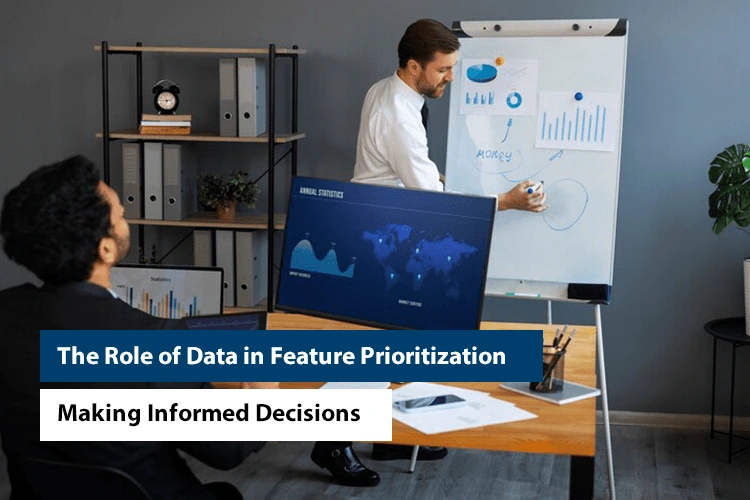
Have you ever had a problem deciding which of the many good features should be implemented in your software roadmap? It remains a challenge for many organizations. In the current world environment user requirements and technological changes are not consistent. A poor decision torments resources and opportunities. Contrarily, a correct decision can enhance user satisfaction proportionately and return on investment. Its exactly here that the role of data in feature prioritization comes to the fore.
Consider this. It is revealed that out of a hundred software projects, only twenty-four deliver the desired improvements. This is because they are centered on wrong concerns and do not consider evidence-based realizations.
It is shocking that product development and software architecture teams are doing so little to support product management teams. They offer no help with tasks related to prioritizing features. It all drives home how important it is to have a solid, evidence-based process for the prioritization of features and not relying on hunches.
In this blog, we will dive deep into how data are essential in feature prioritization. We will discuss practical approaches and plans, best practices, and methods that organizations can use to make appropriate decisions.
What Is the Importance of Data in Feature Prioritization
Feature prioritization is the fundamental strategy for delivering high-quality software systems. It helps to develop an understanding of what aspects the team should work on and what solutions are worth building to create value for both the business and customers.
When there is no structured and measurable way of identifying the importance of features, it can become a random process that results in poor goals and less than impressive results.
Why Data-Driven Decisions Matter
Reduces Bias: Going by emotions or the most vocal stakeholders can be very dangerous, especially when coming up with a decision. It means that using data gives a more objective background.
Improves ROI: Consequently, by optimizing companies’ resources, it is possible to highlight features that have the greatest impact on the business.
Enhances User Satisfaction: Based on data from users, analytics, and surveys, individuals and teams work to create desired features that will attract the target audience.
Key Data Sources for Feature Prioritization
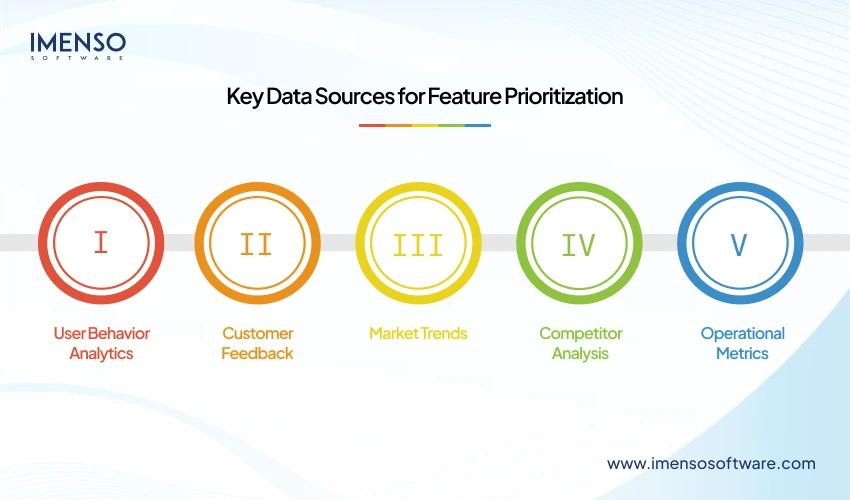
To build a good data-driven prioritization strategy, the correct sources of data are crucial. These include:
User Behavior Analytics
It is also possible to use the Google Analytics Mix panel or Hotjar to observe how people engage with your software. These include time spent on a single session, usage of particular features, and where they ditch the app or service they are using.
Customer Feedback
Sometimes, customers may not be very specific when complaining about a particular aspect of your products through surveys, tickets, and social media platforms, but they can alert you to some shortcomings that the rest of your team may not have noticed.
Market Trends
The dynamics of the current market cannot be overemphasized. For instance, understanding Key SaaS Trends 2025: Most of the time, SaaS companies are not aware of these new demands.
Competitor Analysis
Sailing through the products of key competitors gives a customer distinguishing factors with which to create a unique niche or match with a competitor’s success factors that one needs to close.
Operational Metrics
Metrics like CAC, churn rates, and LTV offer a rates lens to filter out features whose numbers have a direct impact on revenues.
Frameworks for Data-Driven Feature Prioritization
Selecting a framework is what makes your prioritization process much easier. Here are three widely-used models that incorporate data effectively:
RICE Scoring
RICE stands for Reach, Impact, Confidence, and Effort. Each feature is scored based on:
- Reach: How many users will benefit?
- Impact: What does the previously described influence mean in terms of business goals?
- Confidence: How accurate do you feel your estimates are?
- Effort: What is the cost, and how much time is needed?
This framework is particularly helpful in organizing the work of the teams, and it implements numerous features.
Value vs. Effort Matrix
They map features on a two-axis chart according to a value in expectation of utilization and exertion. The aim is to make a high-value-low effort on the features undertaken. However, this uncomplicated but efficient model is best suited for startups and SMEs.
Kano Model
The Kano Model categorizes features into:
- Basic Needs: Core elements for developers have to deliver.
- Performance Needs: Available attributes whose benefit grows with the quality of the attribute.
- Delighters: Special elements that make the user concerned and amazed.
By so doing, businesses can focus on the features that are most desirable to the customers while at the same time targeting to meet the minimum acceptable standard.
Tools for Data-Driven Prioritization
Numerous tools can assist in collecting, analyzing, and leveraging data for feature prioritization:
Jira: It assists you in dealing with backlog and incorporating information into your plans of priority.
Product board: Collects feedback in one place to match organizational objectives with those that are relevant to customers.
Trello: Popular with developers and designers, it is a lightweight technique for rank-ordering features based on their importance.
Aha! : It reflects rich functionalities of creating roadmaps for the company that are aligned with the strategic objectives.
Custom BI Dashboards: Tableau or Power BI and some other tools allow receiving more detailed analytics adjusted to your product.
Overcoming Challenges in Data-Driven Prioritization
Data-driven prioritization also has its setbacks or problems, such as embracing a data-driven approach. Here are common hurdles and how to overcome them:
Data Overload: Do not dwell too much on large quantities of data and thousands of values and indicators.
Stakeholder Misalignment: Data should be employed in making a consensus because this will help in showing the justification of every decision that is being made.
Insufficient Data: If data is an issue, then the initial goal should be to run some experiments and gather some basic data.
The Role of Collaboration in Data-Driven Feature Prioritization
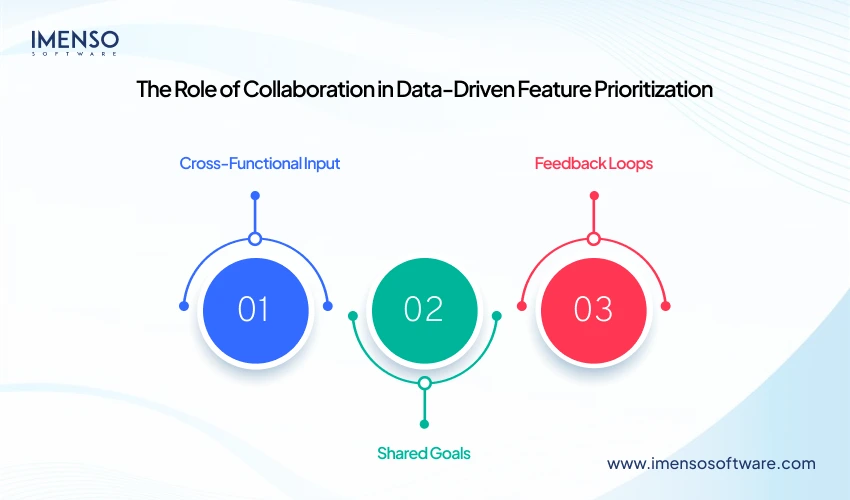
It is not an individual process of feature prioritization based on data. This process calls for the convergence of different teams and personnel, including the product, software, and application developers, marketing department, sales department, and customer support department. In all of it, the features to be incorporated offer good responses to wider organizational goals.
Here’s how collaboration enhances the process:
Cross-Functional Input
Each department brings unique insights:
- Sales and Marketing: Opportunities to discover the customers’ needs and the trends in the market.
- Customer Support: Digitally tracked pain points and feature requirements from the users.
- Development Teams: The optimistic estimate of efforts and technical feasibility.
Gathering all these views gives a holistic view of feature prioritization whereby every viewpoint is considered, including that which is overlooked.
Shared Goals
Understanding goals helps to keep the expectations of everyone aligned. It ensures that everyone works towards a common vision. For instance, where the goal is to increase retention rates, emptying strategies that promote the user experience become a corporate mandate.
Feedback Loops
It also has a lot to do with feedback loops- both micro and macro. As a best practice, the process of prioritizing different activities should be recurrent. Teams ought to pay special attention to revisiting the set priorities now and then reforming them under new data or changing circumstances.
Tools for Collaboration
Business applications such as Slack, Trello, and Product Board allow a team to collaborate and communicate with other members. Communication can take place regarding findings and updated information on the feature prioritization process.
Metrics to Evaluate the Success of Prioritized Features
Unfortunately, the development of a feature is just one part of the process. The next part is the analysis of the feature to assess its effectiveness. On their part, metrics enable an understanding of whether or not the feature achieved its intended objectives and for future priority choices.
Adoption Rates
When will the new feature be used? This can make it easy to establish that when the adoption rates are high, then the topic is highly relevant and useful. However, when it records low rates, then the topic can be considered irrelevant or hard to find or not as valuable as perceived.
User Satisfaction
Depending on its success, the use of the feature can be determined by the results from an NPS (Net Promoter Score) and CSAT (Customer Satisfaction Score) survey.
Engagement Metrics
For instance, the time spent on the feature, the click-through rate, or the rate at which users completed the offered task can help nail down the effectiveness with which users interact with the feature.
Financial Impact
Evaluate if the feature helped to achieve business objectives by analyzing revenue increase rates, customer attrition, or acquisition.
Operational Efficiency
For the internal-facing features, estimate how the processes have been enhanced, whether the number of breakdowns has been affected, or any other form of productivity enhancement.
Through a systematic analysis of these metrics, organizations can improve feature prioritization plans, providing the greatest value.
The Future of Feature Prioritization
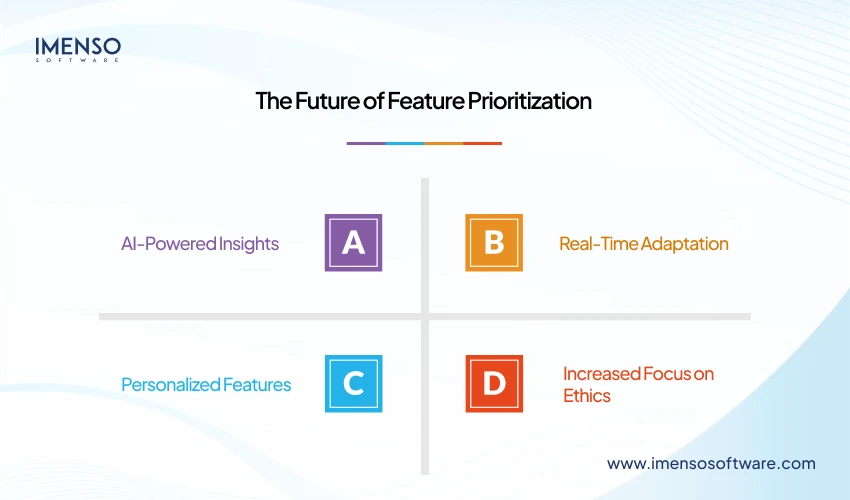
The next decade will create a paradigm shift in the ways that features are prioritized. Technologies like artificial intelligence, machine learning, and prediction analysis will play a role here. Here’s what to expect:
AI-Powered Insights
AI will identify a large amount of user data and predict the potential success of features in order to avoid waste of resources in the development.
Real-Time Adaptation
There will be increased use of dynamic prioritization so that it will be easier to change the priority to another level at any one time, depending on the users and the market trends.
Personalized Features
Data will help businesses to generate features and implement the features for the individual segments of users to increase user satisfaction and, thus, enhance customer loyalty.
Increased Focus on Ethics
Ethical issues will likely emerge as data is increasingly used in the decision-making process. Some examples include issues related to data privacy and conducting business-free analysis processes.
Companies that adopt these innovations will have a competitive advantage. They will deliver value features that are not only appropriate but also requisite for the next several years.
Also Read:
The Impact of Cash Flow on Business Growth: Tips for Founders
How Agile Software Development Can Empower Startups to Innovate Faster
How IT Services Can Help Startups Innovate Faster
Conclusion
Making the right design decision about which features to build is a critical success factor in the modern business landscape. With analytics, customer feedback, and best practices, the business is in a better position to make the right decision as compared to its competitors.
Imenso Software offers your business the best software solutions to help in decision-making processes. We build specific service areas such as Offshore Mobile Apps Development Services or SaaS Product Development as desired, depending on your needs.
But words do not necessarily equal actions. Head over to Clutch and have look at our portfolio.
FAQs
Why is data important in feature prioritization?
Data excludes assumptions, making feature development relevant to customers, the business, and the market by eliminating a lot of assumptions made.
What are the key sources of data for prioritizing features?
Records of user behavior analysis, customer feedback, market and trend, competitor analysis, and operational statistics are crucial sources.
Which frameworks are best for feature prioritization?
Frameworks such as RICE scoring, value vs. effort matrix, and the Kano model are suitable for feature prioritization as all of them utilize data in their execution.
How can tools help in feature prioritization?
Jira, product boards, and BI dashboards are basic tools for collecting, analyzing, and visualizing data for management’s decisions.
What challenges can arise in data-driven prioritization?
Some of the problems faced are the problem of too much (or insufficient) data, and lack of clear decision makers. All of these can be addressed by conducting a more focused analysis and promoting better communication and iteration.
Want more information about our services?
Similar Posts

Managing Investor Expectations: Strategies for Founders and CEOs
In the world of entrepreneurship, gaining an investor is often considered the achievement of the ultimate goal. But in reality, it is a mere point of departure of a lengthy and complex competition. A founder or CEO isn’t only the creator of the company; it is also an intermediary between the investor expectations and choice […]...

ReactJS vs AngularJS choosing the right framework for your next web app
If you looking to build your website or web application with the latest modern web development frameworks, you might be wondering whether you should go for ReactJS or AngularJS. Well, this blog will save time and help you decide which framework is best for your next app. Stay along! A framework may make all the […]...

SaaS vs. PaaS vs. IaaS: Which Cloud Computing Model is Right for Your Business?
As technology continues to evolve at an unprecedented pace, businesses are increasingly turning to cloud computing models to power their operations. Three of the most popular cloud computing models are SaaS, PaaS, and IaaS, each with its unique advantages and disadvantages. But with so many options to choose from, how do you know which cloud […]...
